Lapsed, fee not paid5 drawings
Industrial Equipment · US 9,952,146 B1
Determining gas concentration near planetary surfaces
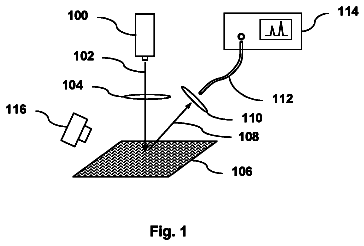
A method and system are provided for determining gas concentration at a region of a planetary surface.
US 9,952,157 B2 · Assignee: The Arizona Board of Regents on behalf of the University of Arizona · Inventors: Utzinger; Urs et al.
Sheet 1 of 14 from the published document. All sheets in the USPTO PDF
Methods for reliable identification of low-contrast lesions within a tissue of a subject comprise delivering an excitation signal to the tissue, wherein the excitation signal is selected to stimulate tissue to produce autofluorescence and/or reflectance. The autofluorescence and/or reflectance is detected, and ratiometric images are produced based on the autofluorescence and/or reflectance images. An imaging system is provided which is configured to carry out such methods, irradiating tissue at a various possible excitation wavelengths, such as UV excitation wavelengths below 300 nm, to elicit fluorescence from specific native fluorophores.
Prior use of autofluorescence endoscopy has been limited to fluorescence in the visible spectrum with unselected contributions from a number of fluorophores, both cellular and extracellular. Fluorescence has not been so stratified by excitation wavelength to consider the roles played by individual fluorophores. Imaging of cellular fluorophores such as tryptophan has been slowed by limited availability of UV-capable microscope objectives and sub-300 nm light sources. White light colonoscopy is the preferred screening technique for colon cancer but fails to detect a significant number of polyps and flat neoplasms. Improving the detection rate can help prevent incident cancers and decrease screening intervals, thus improving screening effectiveness while reducing the overall cost. Low contrast lesions (LCLs), including flat lesions such as those having a height less than half their width, a
1 of 14 drawing sheets so far from the published document, cropped to the drawing. Every sheet is in the USPTO PDF.
What the patent claimed, word for word. All of it is now free to use.
This disclosure is related to systems, instruments and methods for imaging using detected fluorescence, reflectance and/or transmittance for the diagnosis of cancer.
Prior use of autofluorescence endoscopy has been limited to fluorescence in the visible spectrum with unselected contributions from a number of fluorophores, both cellular and extracellular. Fluorescence has not been so stratified by excitation wavelength to consider the roles played by individual fluorophores. Imaging of cellular fluorophores such as tryptophan has been slowed by limited availability of UV-capable microscope objectives and sub-300 nm light sources.
White light colonoscopy is the preferred screening technique for colon cancer but fails to detect a significant number of polyps and flat neoplasms. Improving the detection rate can help prevent incident cancers and decrease screening intervals, thus improving screening effectiveness while reducing the overall cost. Low contrast lesions (LCLs), including flat lesions such as those having a height less than half their width, are of special concern because they are more frequently cancerous than polypoid lesions. In a recent study, flat cancerous lesions were present in 9.4% of male veterans undergoing colonoscopy. Indigo carmine chromoendoscopy increases the detection of flat neoplasms, but is time consuming for use during screening exams in which a high volume of colonoscopies must be performed under demanding time constraints.
Identifying flat lesions using an endogenous contrast mechanism such as autofluorescence (AF) provides benefits over chromoendoscopy by reducing exam time and eliminating dye toxicity concerns. AF image contrast in tissue is derived from native tissue fluorophores (such as tryptophan, collagen, NADH and FAD) as well as from the effects of absorption and scattering of other components (e.g., hemoglobin). Spectroscopic AF studies comparing normal and neoplastic tissues have consistently noted reduced AF intensity from neoplasms. This general result was obtained in colon tissue at excitation wavelengths including 337 nm, 370 nm, and 442 nm. Discrimination based on reduced AF intensity has put emphasis on correcting AF intensity measurements for variations in absorption, illumination intensity, and tissue surface morphology. It has also drawn attention to methods such as time-resolved AF imaging, which largely avoids the confounding factors for intensity measurements but has its own drawbacks including instrumentation complexity and long acquisition times.
Commercial AF endoscopes for the colon include the AFI system (Olympus Medical Systems, Tokyo, Japan) and PINPOINT system (Novadaq Technologies, Mississauga, ON, Canada; formerly the Onco-LIFE and LIFE-GI system, Xillix Technologies). The first developed was LIFE-GI which illuminated tissue with blue light (400-450 nm) and measured both green AF (490-560 nm) and red AF (>630 nm). Later generations of LIFE-GI have included simultaneous blue and red illumination and ceased collection of red AF in favor of red reflectance (>630 nm). The AFI system illuminates with blue light (395-475 nm) and green light (540-560 nm) in succession and measures green/orange AF (490-625 nm) followed by green reflectance. Both of these commercial endoscopes electronically combine a blue-excited AF image and a reflectance image in a single pseudocolor image presented to the physician. Color differences in the pseudocolor composite image are used to signal the observer to the presence of a lesion. Contrast in images from these endoscopes is produced primarily by a loss of green AF in lesions and is perceived as a changed color ratio. Intensity artifacts due to geometrical shape of the specimen would be apparent in a single image; however, they are reduced in the pseudocolor image because the AF and reflectance images are affected by the same artifacts, preserving the color ratio of the resulting image. Several randomized trials comparing AF endoscopy in the colon to standard video endoscopy, narrow band imaging (NBI), or high resolution endoscopy have been published very recently. The outcomes of these studies have been mixed, with some indicating commercial AF endoscopes can reduce polyp miss rate and others showing no significant improvement of AF over other technologies.
Narrow Band Imaging® (NBI, Olympus Inc. New Hope, Pa.) uses blue and green light that is avidly absorbed by hemoglobin and displays blood vessels with high contrast and enhances the visualization of superficial mucosa. Flexible Spectral-Imaging Color Enhancement (FICE®, Fujinon Inc., Wayne, N.J.) uses white light illumination followed by spectral estimation to produce high contrast images. However, neither NBI, FICE or I-Scan® (Pentax Medical Co, Montvale, N.J.) have been shown to improve the detection rate of neoplasms compared to high resolution white light endoscopy.
When light illuminates the mucosa, it is largely reflected and scattered. Some of it is absorbed and re-emitted at a longer wavelength by molecules in tissue (fluorophores) to produce fluorescence of a redder color than the illuminating beam. Fluorophores are inherent biological compounds that emit light, most notably metabolic co-factors such as NADH and FAD, amino acids such as tryptophan, structural proteins such as collagen and elastin as well as porphyrins. Early measurement systems relied upon broadband autofluorescence with unselected contribution from NADH, FAD, collagen and elastin. Initial work with fiberoptic instruments showed reduced fluorescence with neoplastic change. Auto-Fluorescence Imaging (AFI) (Olympus Inc. New Hope, Pa.) is an endoscopic autofluorescence system using blue light excitation in the 400-500 nm wavelength range to produce autofluorescence at 490 to 625 nm. A reflectance image of the mucosa is then taken with green light (550 nm). A pseudocolor (magenta) is computed to show the areas of decreased fluorescence and the surrounding normal mucosa appears green from the reflected light, with the blood vessels appearing dark green. The Onco-Life system (Xillix Technologies Corporation, Richmond, BC, Canada) uses blue light (400-450 nm) for excitation, captures fluorescence from 490 nm to 560 nm and combines it with a red reflectance image. The results from the existing autofluorescence endoscopes have been mixed, with some showing increased detection of polyps, while others showed no improvement over white light endoscopy with missed detection of flat lesions.
Techniques such as enhanced backscattering spectroscopy, partial-wave spectroscopic microscopy and karyometry can be used for risk stratification but are still dependent on standard white light colonoscopy for the detection of neoplasms.
A need exists for optical techniques and instrumentation that sufficiently enhances the image contrast of LCLs, so that the latter can be easily seen and not missed, even during a busy endoscopy schedule or at the end of the queue. The ideal solution preferably highlights the presence and location of a neoplasm, including those that are difficult to see with the naked eye, without dependence on labels or other exogenous chemicals. There is also a need for a technique that highlights the presence of neoplasms conveniently such as by turning on a switch. Finally, a need exists for a multispectral imager with UVC excitation and detection capability, including sub-300 nm excitation.
Methods and systems are disclosed that use fluorescence, reflectance and/or transmittance in conjunction with use of selected ratiometric formulae to produce images of diseased tissues and cells with high contrast. High contrast facilitates identification of the diseased tissue and cells. The systems and associated methods disclosed herein can, in some examples, provide excitation in the mid and/or deep ultraviolet range, including excitation wavelengths less than 300 nm. In some instances, observation of the fluorescence also occurs in the ultraviolet range. Moreover, whereas AFI and OL images display both reflectance and fluorescence in separate color channels without integration and have variable performance due to dependence on unselected cellular and extracellular fluorophores and indeterminate effects of absorption and scattering, the techniques disclosed herein target specific fluorescence signals that produce the greatest contrast (such as fluorescence from tryptophan, FAD, NADH, elastin and/or collagen) while reducing or minimizing effects of absorption and scattering. While the disclosed methods and systems have been demonstrated on in vitro surgical specimens, it has been shown that in-vivo fluorescence results may in fact be superior to in-vitro methods and apparatus.
In a preferred embodiment, ratiometric fluorescence (FR) imaging methods and systems selectively use multiple signals for the detection of a condition such as a neoplasm. Synthetic formulaic images are computed to provide enhanced or maximized contrast between normal and abnormal species within the sample. Abnormal species refers to diseased tissue including but is not limited to cancer, pre-cancer, fibrosis, inflammation, ischemia, mutation or express unregulated behavior (with or without mutation).
In some embodiments, the methods and systems disclosed herein for detecting changes in protein concentrations and/or disease states use targeted autofluorescence of specific native fluorophores found in tissue such as that found, for example, in the colon, the esophagus, the oral cavity, the pancreas, the cervix and the lung. This unique method of image formulation based on expected structural and molecular changes associated with neoplastic transformation may permit improved endoscopic imaging that improves detection of lesions which may be difficult to see and/or missed due to endoscopist inexperience and/or endoscopist independent factors such as poor contrast compared to the surrounding mucosa. Significantly, the FR imaging techniques disclosed may increase detection of serrated and/or flat lesions that are encountered in the colon such as in the proximal colon.
Implementations of the disclosed methods in video rate or still imaging provides increased image contrast between diseased tissue (lesions) and surrounding normal tissues, or between two different disease processes (such as cancer and inflammation), or between different grades of disease such as cancer, high grade dysplasia and low grade dysplasia (pre-cancer). Synthetic formulaic images are computed with the goal to provide increased contrast between lesions and surrounding normal tissue. As used herein, lesion refers to diseased tissue that includes but is not limited to cancer, pre-cancer, fibrosis, inflammation and ischemia. When implemented in endoscopy, such computed formulaic images provide enhanced lesion contrast, exceeding the contrast for normal white light visual observation without the need for labeling or manipulation of the tissue in a real-time manner. In typical examples, imaging methods are based on three or more excitation beams using near-UV or mid-UV excitation. Methods and systems can use combinations of green and blue fluorescence with reflectance, to provide effective contrast enhancement using division, multiplication, subtraction and additions of individual images intensities. The disclosed approaches are not dependent on use of dyes; permit real time computation of formulaic images, are integrable into endoscopes; provide superior imaging of flat lesions that are easily missed in conventional approaches, and provide well defined lesion borders. In some examples, precancerous lesions of the cervix or oral cavity, or adenomas or adenocarcinomas in colon specimens are identified. In some examples, an agent is administered to treat, prevent or ameliorate the disease state which is diagnosed. Other applications include microscopy, colonoscopy and sigmoidoscopy.
FIG. 1 is a simplified schematic diagram of a representative multispectral imaging system.
FIG. 2 is a simplified schematic diagram of an exemplary UV autofluorescence microscope in an upright transillumination configuration. In FIG. 2 , the illumination light path is from bottom to the top of diagram. Optical elements have high transmission in the sub-300 nm range of interest except for the UV objective which has very low transmission below 340 nm.
FIG. 3 is a simplified schematic diagram showing an arrangement for cell AF imaging in transmission mode using an upright microscope. Cultured cells are immersed in low AF media (HBSS & L-glutamine). Stage and objective heaters (not shown) maintain specimen temperature within 2 degrees of 37° C. Suspension cells are also imaged in this setup but settle and rest on the surface of the quartz slide.
FIG. 4 is a flowchart showing a representative method of selecting and producing ratiometric images for the diagnosis of a disease state.
FIG. 5 is a pair of images showing regions of interest (ROIs) assigned in the vicinity of an adenocarcinoma lesion. The top image is a reference image with arrows pointing to the raised edge of the adenocarcinoma. The bottom image is an F280 image with three circular ROIs labelled with an N to designate normal tissue and three unmarked ROIs representing the lesion.
FIG. 6 is a plot showing contrast results for adenomas and adenocarcinomas (includes low-contrast and non-low-contrast lesions) using various single wavelength, non-ratiometric auto-fluorescence and reflectance images.
FIG. 7 is a plot showing contrast results in adenomas and adenocarcinoma low-contrast lesions (LCLs) using various single wavelength, non-ratiometric auto-fluorescence and reflectance images.
FIGS. 8A and 8B are scatter plots showing performance of an optimized contrast metric (Equation 2) and the Weber contrast metric, respectively, for measurement of contrast in ratiometric images produced by an exemplary ratiometric imaging system. The metrics are assessed by comparing against visually assessed contrast. Each data point represents a single ratio image of a particular specimen. Linear fits to the data indicate that the optimized metric is typically a better indicator of useful contrast in ratio images than the Weber contrast.
FIGS. 9A-9F are images showing the effects of autoscaling and histogram equalization on display ratio images formulated by the exemplary ratiometric imaging system. FIG. 9A is a standard photograph of a first adenoma taken with digital SLR camera. FIG. 9B is an autoscaled R27 ratio image of the first adenoma. FIG. 9C is a histogram equalized R27 ratio image of the first adenoma. FIG. 9D is a second adenoma from another specimen imaged by digital SLR camera. FIG. 9E is an autoscaled R7 ratio image of the second adenoma. FIG. 9F is a histogram equalized R7 ratio image of the second adenoma. Images A, B, and C demonstrate that autoscaling of ratio image R27 is more effective than histogram equalization, while D, E, and F show the benefit of histogram equalization for ratio image R7. Tattoo ink applied prior to excision caused the dark color artifacts in images A (immediately left of polyp) and D (bottom center of image).
FIG. 10 is a bar chart showing the performance of formulaic ratio images produced by the exemplary ratiometric imaging system based on visual assessment. Bars represent the percentage of specimen images for which a majority of observers (at least 4 of 7) deemed the image “adequate” for lesion identification. Diamonds represent the percentage of specimen images for which at least 3 of 7 observers deemed the image “exception”. Results are stratified by low contrast lesion (LCL) status of specimens.
FIG. 11 is a bar graph comparing visually-assessed performance of existing technologies to the performance of the exemplary ratiometric imaging system disclosed herein using the novel ratio image R27: 340/440. Ratio image R21=F440red/F440 approximates the red/green ratio used for polyp discrimination by LIFE-GI. Image R22=R555/F440 approximates the G/R ratio used by the AFI system. Bars represent the percentage of low contrast lesion images for which the ratio image was deemed “adequate” for lesion identification by at least 4 of 8 observers. Diamonds represent the percentage of specimen images for which the ratio image was deemed “exceptional” by 3 or more of 8 observers. The rightmost bar indicates the performance achievable using R27 and R30 in parallel, such as by combining ratio images.
FIG. 12 is a stacked bar graph showing visually-assessed combined performance of pairs of formulated ratio images. Overall bar height represents the percentage of specimen images for which at least one of the two listed ratio images was deemed “adequate” for lesion identification by a majority of observers (at least 4 of 7). The relative size of shaded bar segments indicates the unique contribution of each ratio image, as well as the contribution that is common to both ratios. Diamonds represent the percentage of specimen images for which at least one of two ratio images was deemed “exceptional” by 3 or more of 7 observers. R10 and R30 are the most effective pair for this dataset.
FIGS. 13A and 13B are bar graphs showing contrast levels achieved for adenocarcinomas and adenomas, respectively, by existing imaging systems (Sim A=AFI system and Sim B=OL system) and by the exemplary ratiometric imaging system disclosed herein using novel formulaic ratio images.
FIG. 14 is a bar graph showing contrast levels for proximal and distal lesions achieved by the exemplary ratiometric imaging system disclosed herein using novel formulaic ratio images.
FIGS. 15A-15C are autofluorescence images of hTERT-HPNE cells excited at A) 280 nm, B) 370 nm, and C) 440 nm. FIG. 15A shows the ability to clearly visualize entire cells. The arrow in FIG. 15C shows an area of difference compared the other images including FIG. 15B .
FIGS. 16A-16F are autofluorescence images of MIA PaCa-2 cells excited at A) 280 nm, B) 370 nm, and C) 440 nm; and fluorescent probe images (D-F) taken following 4 minutes incubation in a multicolor stain. Nuclei are visible as darker regions of cells in both FIG. 16A and FIG. 16B . FIG. 16A shows bright nucleoli, two of which are designated with arrow. FIG. 16B shows a string or mesh-like pattern characteristic of mitochondria and corresponds with the MitoTracker stain in FIG. 16E . Fluorescent probe images reflect that a few cells (3 o'clock, 8 o'clock positions) detached during media exchange. Note the similar appearance of FIG. 16C to the LysoTracker stain in FIG. 16F .
All publications, patent applications, patents, and other references mentioned herein are incorporated by reference in their entirety for all purposes.
Although methods and materials similar or equivalent to those described herein can be used to practice or test the disclosed technology, suitable methods and materials are described below. The materials, methods, and examples are illustrative only and not intended to be limiting.
The singular forms “a,” “an,” and “the” refer to one or more than one, unless the context clearly dictates otherwise. For example, the term “comprising a specimen” includes single or plural specimens and is considered equivalent to the phrase “comprising at least one specimen.” The term “or” refers to a single element of stated alternative elements or a combination of two or more elements, unless the context clearly indicates otherwise. As used herein, “comprises” means “includes.” Thus, “comprising A or B,” means “including A, B, or A and B,” without excluding additional elements. Further, the term “coupled” does not exclude the presence of intermediate elements between the coupled items.
The systems, apparatus, and methods described herein should not be construed as limiting in any way. Instead, the present disclosure is directed toward all novel and non-obvious features and aspects of the various disclosed embodiments, alone and in various combinations and sub-combinations with one another. The disclosed systems, methods, and apparatus are not limited to any specific aspect or feature or combinations thereof, nor do the disclosed systems, methods, and apparatus require that any one or more specific advantages be present or problems be solved. Any theories of operation are to facilitate explanation, but the disclosed systems, methods, and apparatus are not limited to such theories of operation.
Although the operations of some of the disclosed methods are described in a particular, sequential order for convenient presentation, it should be understood that this manner of description encompasses rearrangement, unless a particular ordering is required by specific language set forth below. For example, operations described sequentially may in some cases be rearranged or performed concurrently. Moreover, for the sake of simplicity, the attached figures may not show the various ways in which the disclosed systems, methods, and apparatus can be used in conjunction with other systems, methods, and apparatus. Additionally, the description sometimes uses terms like “produce” and “provide” to describe the disclosed methods. These terms are high-level abstractions of the actual operations that are performed. The actual operations that correspond to these terms will vary depending on the particular implementation and are readily discernible by one of ordinary skill in the art.
In some examples, values, procedures, or apparatus' are referred to as “lowest”, “best”, “minimum,” or the like. It will be appreciated that such descriptions are intended to indicate that a selection among many used functional alternatives can be made, and such selections need not be better, smaller, or otherwise preferable to other selections. I. Definitions
In order to facilitate review of the various embodiments of the disclosure, the following explanations of specific terms are provided:
Animal: Living multi-cellular vertebrate organisms, a category that includes, for example, mammals and birds. The term mammal includes both human and non-human mammals. Similarly, the term “subject” includes both human and veterinary subjects.
Adenoma: A collection of neoplastic cells of glandular origin that has not yet acquired the ability to invade the basement membrane of the sub-mucosal tissue.
Adenocarcinoma: An adenoma that has acquired the ability to invade the basement membrane of the sub-mucosal tissue.
Autofluorescence: Fluorescence emitted by a native fluorophore.
Cancerous: Neoplastic cell/tissue growth of any type, including benign or malignant growths of glandular (e.g., adenoma, adenocarcinoma) or non-glandular origin.
Contrast: A difference in luminance associated with a tissue image that makes a lesion in the image distinguishable from surrounding tissue.
Diagnostic: Identifying the presence or nature of a biological or medical condition, such as, but not limited to, presence of a genetic mutation, systemic or localized concentration in a subject of an administered pharmaceutical composition, occurrence of dysplastic nevus syndrome, or occurrence of melanoma.
Excitation Signal: Optical radiation at a selected wavelength or wavelength range for producing fluorescence, reflectance and/or transmittance.
Fluorescence: Emission of longer wavelength (lower frequency) photons (energy) by a molecule that has absorbed photons (light) of shorter wavelengths (higher frequency). Both absorption and radiation (emission) of energy are unique characteristics of a particular molecule (structure) during the fluorescence process. Light is absorbed by molecules causing electrons to become excited to a higher electronic state. The electrons remain in the excited state for a very short period, and then, assuming all of the excess energy is not lost by collisions with other molecules, the electron returns to the ground state. Energy is emitted during the electrons' return to their ground state.
Image: Refers to a viewable image for direct viewing by a human observer, a projected image to be directed to a detector, or a stored representation of such an image such as a digital data file.
Native Fluorophore: A naturally occurring compound or substance within a subject that emits fluorescence in response to an excitation signal. A fluorophore may be a chemical compound, polypeptide, protein or other molecular element, or any part thereof. Of particular interest herein are those native fluorophores that exhibit an association with neoplastic transformation in a tissue of an organ such as the colon. These native fluorophores exhibit an increased or decreased fluorescence in association with a neoplastic process occurring in the vicinity of the fluorophore. Such an association may reflect an underlying positive or negative correlation with the neoplastic process, such as increased or decreased abundance and/or bioactivity of the fluorophore. Exemplary native fluorophores include, without limitation, tryptophan, collagen, NADH, FAD, collagen, elastin, lipofuscin, porphyrins, phenylalanine and tyrosine. Native fluorophores exhibiting an established association with neoplastic transformation include, without limitation, tryptophan, FAD, NADH and collagen. Fluorescence emitted by such fluorophores is referred to as native fluorescence.
Optical Radiation: Propagating electromagnetic radiation having wavelengths between 100 nm and 1000 nm. Optical radiation at wavelengths between 400 nm and 700 nm is also referred to as illumination.
Preventing, Treating or Ameliorating a Disease: Preventing a disease refers to precluding the onset or inhibiting the full development of a disease such as melanoma and is a form of prophylaxis. Treating refers to a therapeutic intervention that ameliorates a sign or symptom of a disease or pathological condition such as melanoma after it has begun to develop. Ameliorating refers to the reduction in the number or severity of signs or symptoms of a disease, such as cancer.
Ratiometric Formula (RF): Any formula involving a ratio (a quantity divided by another quantity) which is used to calculate intensity values for a ratiometric image based on measured fluorescence and/or reflectance data. The ratiometric formula will generally have at least one fluorescence or reflectance value but may have one, two or multiple measured values in the numerator or denominator. The ratio may be, for example, simply the inverse of a fluorescence or reflectance value.
Ratiometric Image (or Ratio Image): An image produced in accordance with a ratiometric formula wherein the intensities produced along the image are in proportion to ratios calculated based upon fluorescence/reflectance determined for various points along the image.
Reflectance: A ratio of the optical power actually exiting a sample (such as a tissue portion) under study to the amount that would exit if none were absorbed. Reflectance is typically considered to be unit-less. Reflectance spectroscopy can be combined with fluorescence spectroscopy (see WO 1999057529 A1, which is incorporated herein by reference).
Sample: A biopsy, serum, blood, plasma or other substance from an animal (e.g., human) that includes biomolecules and antibodies representative of those present in the animal. Samples can include processed tissue samples, blood samples, secretions, and the like. A sample can be an unharvested tissue located within the body of a subject which may or may not be subjected to one or more visual inspections and/or biochemical assays. As another example, a sample may be tissue from a nevus harvested during a biopsy which also may optionally be subjected to one or more visual inspections and/or biochemical assays.
Subject: Living multi-cellular vertebrate organisms, a category that includes both human and veterinary subjects, including human and non-human mammals.
Weber contrast: A metric which may be used to quantify contrast within images. Weber contrast is defined as the absolute value of the difference between the luminance of a lesion or other image feature and the luminance of the background which is then divided by the luminance of the background. Mathematically, Weber contrast is represented as: |(I−I.sub.b)|/I.sub.b, where I is the luminance of the selected feature and I.sub.b is the luminance of the background. If parameters are set such that the luminance of a cancerous lesion or other feature is higher than the background, the Weber contrast formula is simply the difference between the luminance of the lesion and the luminance of the background which is then divided by the luminance of the background. Mathematically, this is represented as: (I−I.sub.b)/I.sub.b Contrast may also be calculated using other metrics, including the optimized contrast metric disclosed herein. II. Imaging Methods and Instrumentation
Methods and systems based on use of ratiometric fluorescence imaging for the diagnosis and characterization of disease are disclosed herein. A representative spectral imaging system is configured to produce autofluorescence and/or reflectance images by irradiating a sample illuminating and detecting reflected, scattered, or fluorescence radiation over a range of wavelengths, such as irradiation from 260 to 650 nm and detection from 340 to 650 nm to collect visual information, including both video and still images of tissues. In various embodiments, irradiation be over wavelengths between 200 to 700 nm and detection may be over wavelengths between 300 and 800 nm. The area imaged may be narrow or macroscopic (e.g., 40 mm by 40 mm). The specimen may be in vitro (i.e., resected tissue) or in vivo. The tissue may be imaged at a surface of the tissue without special labels, exogenous chemicals and/or other manipulation of the tissue. In some embodiments, a portion of the tissue which is not located at the surface is imaged, either by manipulation of the specimen to expose said portion or by physical penetration of the specimen using the endoscope or other apparatus within the system which comprises or is connected to the imager.
The imaging system comprises a light source which can produce monochromatic or polychromatic optical radiation. If a polychromatic tight source is used, a bandpass filter may be attached. The bandpass filter may allow optical radiation at one or more frequencies, by transmission, reflection, diffraction or other process to pass through. The frequencies associated with the light source are selected to elicit data diagnostic of a tissue condition, in various embodiments, the light source emits optical radiation at a frequency chosen to excite a native fluorophore to emit a fluorescence signal. In various embodiments, the light source emits light at a frequency chosen to elicit reflectance from a sample. A wide variety of light sources may be used, including but not limited to a xenon lamp.
The imaging system also comprises a detector which may further comprise, for example, a photomultiplier tube, a photosensitive diode, a charge coupled device, or any other type of electromagnetic radiation sensor. In one example, detectors charge coupled device and/or could be located at a distal end of an endoscope or catheter instrument. The charge coupled device is coupled to an image processor. If the detector is not a charge coupled device located at a distal end of an instrument, the returned electromagnetic radiation may be conducted to the detector through one or more return optical fibers. The return optical fibers and the excitation optical fibers may be co-located within the same instrument, or they may be located in separate instruments. Alternately, the same optical fibers within an instrument may be used to perform both excitation and return functions. In certain embodiments, the detector may be in communication with a downstream microprocessor through a wired or wireless data connection.
With reference to FIG. 1 , a representative imaging system 100 includes a light source 102 configured to produce one or more excitation beams at selected wavelengths or wavelength ranges. The light source 102 includes a xenon lamp 103 (or other radiation source) that couples an optical radiation beam to an ultraviolet cold mirror 104 configured to transmit infrared radiation and reflect ultraviolet radiation so as to reduce infrared power in an excitation beam. The optical radiation beam is then directed to a shutter 106 and a first filter wheel 108 that includes one or more optical filters configured to provide a selected spectral content for an excitation beam. The shutter 106 and the first filter wheel 108 are coupled to a filter wheel controller 110 that is configured to insert a suitable optical filter into the optical radiation beam and to block or unblock the optical radiation beam with the shutter 106 .
A lens 114 couples the optical radiation beam into a fiber bundle 116 , typical a quartz fiber bundle. The fiber bundle 116 delivers the optical radiation beam to a beam shaping lens 120 and an ultraviolet polarizer 122 . A mirror 124 directs the optical radiation beam as an excitation beam to a specimen 130 .
Radiation from the specimen 130 and responsive to the excitation beam is coupled through a second filter wheel 134 , and an imaging lens 136 forms an image of at least a portion of the specimen 130 or specimen surface at a CCD or other detector 140 . The detector 140 is coupled to an image processor 142 that is configured to perform ratiometric calculations based on detected image intensities in selected regions of interest, and provide suitable images for viewing at a display 144 . In some cases, processed images are delivered for remote viewing via a local or wide area network or the internet, or images from the detector 140 can be communicated to a remote location for ratiometric processing. As shown in FIG. 1 , the excitation beam and imaging optical system are secured to a mechanical arm 150 so that images of specimens at a plurality of locations or different locations on the same specimen can be obtained.
A representative prototype imaging system for measuring AF and reflectance as shown in FIG. 1 can be implemented as follows. Diffuse reflectance images are collected using a pair of crossed UV polarizers (available at Meadowlark Optics, Frederick, Colo.) to minimize specular reflections. The light source may be a xenon arc lamp system (e.g., 300 W, Lambda LS, available at Sutter Instruments, Novato, Calif.) which may have a built-in filter wheel such as a ten-position filter wheel. Use of a full-spectrum bulb allows significant output in the 260-300 nm range but may necessitate a UV cold mirror (Chroma, Bellows Falls, Vt.) with high reflectance in the same range and/or an ozone filter (Oriel Instruments, Irvine, Calif.) to eliminate health risks from ozone produced by interaction of UVC light with air. The purpose of the UV cold mirror is to remove near infrared light which can be damaging optical filters. A first filter wheel and controller (Lambda 10-3, Sutter Instruments, Novato, Calif.) is provided to allow automated selection of illumination and/or detection wavelengths via interference filters. A fiber bundle (FiberTech Optica, Ontario, Canada) which may be a custom quartz material delivers filtered illumination from the lamp to the specimen, and fused silica lenses perform light coupling and collimation. The fiber bundle may comprise a feedback fiber for monitoring lamp power fluctuations. A thermoelectrically cooled, UV-enhanced camera (PhotonMAX: 512B, Princeton Instruments, Trenton, N.J.) with intensified CCD (e2v CCD97B, e2v technologies, Chelmsford, England) is mounted on a rigid mobile arm and equipped with UV-transmitting and color-corrected imaging lens (f/3.5, f=63 mm, Resolve Optics, Chesham, UK) with a fixed working distance of 25 cm. A second ten-position filter wheel (H) is mounted directly in front of the imaging lens. An interface may be used to control system components including filter wheels, mechanical shutter, and image acquisition. In an embodiment, automation via scripting allows for rapid sequential capture of a multitude of images of interest (and their corresponding dark frames) in a short time period such as in about 90 seconds.
The optical radiation provided to the specimen be narrowband, such as ˜20 nm full width half maximum (FWHM), and accomplished with band-pass interference fillers. Optical radiation from the specimen associated with reflection or fluorescence may be coupled to a detector via longpass or other optical filters. In some examples, the short wavelengths may require special optics as the transmittance of standard optical materials is often limited at wavelengths shorter than about 380 nm.
Long-pass filters may be selected to enable collection of weak AF using very short exposure times. Optical radiation for diffuse reflectance images is preferably passed through a drop-in UV polarizer and collected through a second UV polarizer mounted in the emission filter wheel. AF contributions to reflectance images are generally neglected because contributions are typically 1000 times less than reflectance contributions.
Excitation wavelengths and emission bands of AF images can be chosen to target native fluorophores (such as tryptophan, collagen, NADH, FAD, collagen, elastin, lipofuscin, porphyrins) whose concentrations and/or distributions can change with disease state such as a cancerous process. In one embodiment, one or more native fluorophores exhibit a change (such as a change in concentration, distribution or activity) in association with a cancerous process. This cancerous process may be malignant or benign, and may specifically involve the colon, such as the proximal and/or distal colon. The cancerous process may specifically be an adenocarcinoma or adenoma (including a tubulovillous adenoma). In an embodiment, the one or more native fluorophores exhibit a change (such as a change in concentration, distribution or activity) in association with an inflammatory process
Six exemplary diffuse reflectance image types collected by the system disclosed herein are listed in Table 1. These are crossed polarization images using narrow band illumination (20 nm FWHM) centered at wavelengths specified in the image names. They range from R370 in the UV to R555 in the green with maximum absorption by hemoglobin in the blue (400-450 nm).
TABLE-US-00001 TABLE 1 Reflectance images with names specifying illumination wavelength Name Color R370 UVA R400 Violet R415 Violet R440 Blue R480 Blue-Green R555 Green
For excitation filters, percent transmission outside of the desired illumination band is desirably 10.sup.5 times lower than the peak transmission inside this band. Two or more filters may be stacked to achieve this condition. System bandpass excitation filters may possess out-of-band attenuation 4 to 5 orders of magnitude greater than in-band. Relative attenuation may be greater as this measurement is limited by the dynamic range of the spectrophotometer. Longpass emission filters preferably show attenuation 5 orders of magnitude below the cut-on wavelengths. Narrowband illuminations, including 320, 340, and 440 nm, may reveal no measurable out-of-band light (indicating at least 5 orders of magnitude less out-of-band illumination). For example, the 280 nm narrowband illumination may produce no measurable out-of-band light aside from a spectral feature at 825 nm that is 4.4 orders of magnitude below peak intensity. In some embodiments, an additional shortpass filter (FF01-680/SP, high transmission 345 to 655 nm, Semrock Inc., Rochester, N.Y.) may be placed, transiently or permanently, in front of the camera's imaging lens to eliminate the influence of small amounts of NIR illumination which may leak through excitation filters.
The description continues in the full USPTO document.
About 6,038 words. The USPTO PDF has it with every drawing.
Fees are due 3.5, 7.5 and 11.5 years after grant. This patent expired on April 24, 2026, so the fee marked "not paid" was the one that went unpaid.
FORMULAIC IMAGING FOR TISSUE DIAGNOSIS
Filed Jul 2013 · published Jul 2015Tissue imaging and visualization of lesions using reflectance and autofluorescence measurements
Filed Jul 2013 · granted Apr 2018Earlier publications, parents and continuations. None of them can still be enforced, or this patent would not be listed.
Prior art cited by the examiner or applicant. Useful when you check your own idea for novelty.
Everything on this page comes from the documents linked above.