 Lapsed, fee not paid17 drawings
Software & Apps · US 8,769,399 B2
Aiding search-result selection using visually branded elements
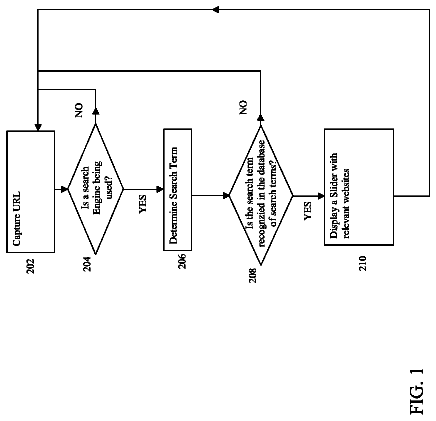
Computer-storage media, methods, and systems for formatting and surfacing a badge are provided.
US 8,769,438 B2 · Assignee: Ancestry.com Operations Inc. · Inventors: Mangum; Gary et al.
Sheet 1 of 11 from the published document. All sheets in the USPTO PDF
The present invention discloses an air fan turbine positioned horizontally or vertically in close proximity to the exhaust fan system of air handler systems. These turbine units catch the exhausted air flow from the exhaust ports of these air handler units to drive the turbine blades which are attached to a generator. As the propellor blades spin, they generate electricity. Thus, the man made air flow known as exhaust from the air handler systems is used to produce electricity. This invention not only uses man made air flow, but also repositions the air turbine 90.degree. from a horizontal position to a vertical position to receive wind air from the atmosphere. When the air handler unit is turned off, a signal is sent to mechanically move the air turbine to the vertical position to redirect itself to then catch natural wind airflow on both roof top and ground mounted units.
Interest in genealogical research has grown tremendously over the last century and has become a popular hobby among all age groups. Much of the excitement surrounding genealogy stems from a researcher's ability to study the various relationships within their family trees--to see who they are related to and how. When a researcher discovers that they are in some way related to another individual, it is common for the researcher to desire to understand the exact nature of that relationship. Genealogical records often include relationship information that identifies how records and sub-records are related or connected. These records may include other information as well, such as date of birth, date of death, date of marriage, city and/or state of residence, spouse information, children information, etc. However, only a limited amount of this information may be displayed on a touch-screen dev
8 of 11 drawing sheets so far from the published document, cropped to the drawing. Every sheet is in the USPTO PDF.
What the patent claimed, word for word. All of it is now free to use.
This application is related to U.S. patent application Ser. No. 13/035,845 filed on Feb. 25, 2011 entitled "ANCESTOR-TO-ANCESTOR RELATIONSHIP LINKING METHODS AND SYSTEMS" which is incorporated herein by reference. This application is also related to co-pending U.S. patent application Ser. No. 13/035,816 filed on Feb. 25, 2011 entitled "METHODS AND SYSTEMS FOR IMPLEMENTING ANCESTRAL RELATIONSHIP GRAPHICAL INTERFACE" which is also incorporated herein by reference.
The present invention relates generally to methods and systems for displaying genealogical records on a touch-screen device and more specifically to methods and systems for transitioning between displayed records and/or between one or more views.
Interest in genealogical research has grown tremendously over the last century and has become a popular hobby among all age groups. Much of the excitement surrounding genealogy stems from a researcher's ability to study the various relationships within their family trees--to see who they are related to and how. When a researcher discovers that they are in some way related to another individual, it is common for the researcher to desire to understand the exact nature of that relationship.
Genealogical records often include relationship information that identifies how records and sub-records are related or connected. These records may include other information as well, such as date of birth, date of death, date of marriage, city and/or state of residence, spouse information, children information, etc. However, only a limited amount of this information may be displayed on a touch-screen device at one time
It is often desired and/or important to visually display how genealogical records and/or sub-records are linked or related (i.e., display the connections between records). For example, it may be helpful to display an individual's ancestors so that users can visually determine how the individual is connected or interconnected with other individuals in a genealogical chart. Showing the connectedness of other records may likewise be important, such as the connection between different types of family relationships, such as sibling, parent, child, cousin, etc. Because of the usefulness of such displays, there is a need in the art for improved ways to display and navigate genealogical records.
In one embodiment, a method for navigating between a plurality of genealogical records displayed on a touch-screen device is discussed. The method includes receiving a selection of a first genealogical record in the plurality of genealogical records and determining a plurality of familial records in the plurality of genealogical records that are related to the first genealogical record through one or more familial lines. The method further includes determining a first display group comprised of the first genealogical record and a familial record in each familial line, and determining a second display group comprised of a second familial record in a first familial line, wherein the second familial record in the second display group sequentially follows a familial record in the first display group. The method also includes causing to be displayed on a touch screen of the touch-screen device, a first plurality of icons representing each familial record in the first display group, where each icon in the first plurality of icons is positioned according to the one or more familial lines such that each familial line forms a familial line direction. Additionally, the method includes determining a direction from a finger gesture input from the touch screen of the touch-screen device, and determining that the first familial line corresponds to the direction of the finger gesture input. The method further includes adding to the first display group, the second familial record from the second display group, and adding to the second display group, a third familial record in the first familial line that follows after the second familial record in the second display group. The method also includes causing to be displayed on the touch screen of the touch-screen device, an icon representing the second familial record added to the first display group.
In another embodiment, a system for displaying and navigating between a plurality of genealogical records is discussed. The system may include a processor, a touch screen; and a storage memory coupled with the processor. The storage memory may include a set of instructions stored thereon which, when executed by the processor, cause the processor to store the plurality of genealogical records and receive a selection of a first genealogical record in the plurality of genealogical records. The instructions may further cause the processor to determine a plurality of familial records in the plurality of genealogical records that are related to the first genealogical record through one or more familial lines, and determine a first display group comprised of the first genealogical record and a familial record in each familial line. The instructions may also cause the processor to determine a second display group comprised of a second familial record in a first familial line, wherein the second familial record in the second display group sequentially follows a familial record in the first display group. The instructions may additionally cause the processor to cause to be displayed on the touch screen, a first plurality of icons representing each familial record in the first display group, wherein each icon in the first plurality of icons is positioned according to the familial lines such that each familial line forms a familial line direction. Moreover, the instructions may cause the processor to determine a direction from a finger gesture input from the touch screen, and determine that the first familial line corresponds to the direction of the finger gesture input. The instructions may further cause the processor to add to the first display group, the second familial record from the second display group, and add to the second display group, a third familial record in the first familial line that follows after the second familial record in the second display group. The instructions may also cause the processor to cause to be displayed on the touch screen of the touch screen, an icon representing the second familial record added to the first display group.
In another embodiment, a non-transitory computer-readable medium is discussed. The medium may include a set of instructions stored thereon, which when executed by a computer, cause the computer to store the plurality of genealogical records and receive a selection of a first genealogical record in the plurality of genealogical records. The instructions may further cause the computer to determine a plurality of familial records in the plurality of genealogical records that are related to the first genealogical record through one or more familial lines and determine a first display group comprised of the first genealogical record and a familial record in each familial line. The instructions may also cause the computer to determine a second display group comprised of a second familial record in a first familial line, wherein the second familial record in the second display group sequentially follows a familial record in the first display group. The instructions may additionally cause the computer to cause to be displayed on a touch screen, a first plurality of icons representing each familial record in the first display group, wherein each icon in the first plurality of icons is positioned according to the familial lines such that each familial line forms a familial line direction. Moreover, the instructions may cause the computer to determine a direction from a finger gesture input from the touch screen, and determine that the first familial line corresponds to the direction of the finger gesture input. The instructions may further cause the computer to add to the first display group, the second familial record from the second display group, and add to the second display group, a third familial record in the first familial line that follows after the second familial record in the second display group. The instructions may also cause the computer to cause to be displayed on the touch screen, an icon representing the second familial record added to the first display group.
A further understanding of the nature and advantages of the present invention may be realized by reference to the following drawings. In the appended figures, similar components or features may have the same reference label. Further, various components of the same type may be distinguished by following the reference label by a second label that distinguishes among the similar components.
FIG. 1 is an embodiment of a genealogical chart that may be used to record family relationships.
FIG. 2A illustrates a display for a record display program with an exemplary arrangement of icons corresponding to records that are interrelated according to one embodiment.
FIG. 2B illustrates a transition between different display groups according to one embodiment.
FIG. 2C illustrates another transition between different display groups according to one embodiment.
FIG. 3A illustrates the display of a portion of a genealogical chart on a touch-screen device according to one embodiment.
FIG. 3B illustrates various examples of finger gestures that may be accepted from the touch-screen according to one embodiment.
FIG. 4A illustrates the display of another portion of a genealogical chart on a touch-screen device according to one embodiment.
FIG. 4B illustrates various additional examples of finger gestures that may be accepted from the touch-screen according to one embodiment.
FIG. 5 illustrates a flowchart for using touch-screen finger gestures to navigate through a genealogical chart according to one embodiment.
FIG. 6 is a generalized schematic diagram illustrating a computer system for implementing aspects of the present invention.
FIG. 7 is a block diagram illustrating a networked system of computers for implementing aspects of the present invention.
While various aspects and features of certain embodiments have been summarized above, the following detailed description illustrates a few exemplary embodiments in further detail to enable one of skill in the art to practice such embodiments. In the following description, for the purposes of explanation, numerous specific details are set forth in order to provide a thorough understanding of the described embodiments. It will be apparent, however, to one skilled in the art that other embodiments of the present invention may be practiced without some of these specific details. In other instances, well-known structures and devices are shown in block diagram form. Several embodiments are described herein, and while various features are ascribed to different embodiments, it should be appreciated that the features described with respect to one embodiment may be incorporated into other embodiments as well. By the same token, however, no single feature or features of any described embodiment should be considered essential to every embodiment of the invention, as other embodiments of the invention may omit such features.
A set of embodiments provides solutions (including without limitation, devices, systems, methods, software programs, and the like) for implementing a method for the interactive display of familial relationships on a touch-screen device. Instead of displaying only a textual description of how two individuals in a genealogical tree are related to each other, aspects of the present invention improve the prior art by causing to be graphically displayed a view of the connecting relationships for each level in a generational hierarchy comprised of various familial lines. Navigation along the familial lines may be accomplished by using various finger gestures on the touch-screen device that provide directional information that align with a direction of various relationship pathways.
To begin, family relationships for genealogical research may be stored and displayed in one or more genealogical charts. FIG. 1 illustrates an embodiment of a chart 100 that may be used to display family relationships. Genealogical charts representing family trees may be displayed on the screen of a computer system. Each node in the chart represents a person within a family, and a set of lines connecting the nodes may represent family relationships that connect the various family members to each other within the family structure. Such relationships may consist of sibling, parent, or child relationships, and/or the like. By way of example, node 110 represents a single family member, and relationship 115a represents a parent-child relationship between the parent node 120a and a child node 110.
The view of the genealogical tree shown in FIG. 1 displays details intended to convey information regarding a particular family line. However, the number of nodes added to the family line may increase as more individuals are added to the family, increasing the number of nodes that must be simultaneously displayed if the entire family line is to be viewed at once. Consequently, a graphical representation of a genealogical chart may contain various levels or views that focus on particular subdivisions of the chart. A top-level view may depict the entire tree, and may include very few visible details related to the individual nodes. When the view is changed to the next lower level, for instance, the entire tree may no longer be visible in the display. Instead, the view may zoom in to display a group of families within the chart. In some embodiments, these may correspond to groupings of family lines. As the display zooms in to the next lower level, for instance, a family level, the display may be limited to a single family or family line, such as the line depicted in FIG. 1. Finally, the display may be zoomed in to an individual level, wherein a single individual is displayed with his/her immediate family. The individual view may also be called a "detail" view wherein all the stored information related to the individual may be displayed, such as dates, videos, documents, recordings, and/or the like. In accordance with embodiments of this invention, various methods have been developed that display an optimal amount of information for each node, while simultaneously displaying surrounding relationship information and allowing for convenient navigation around the tree.
When the user chooses to zoom to another level, such as the family view, the display may zoom within the display level (i.e. within the tree view or family view) or in some embodiments zooming in or out may cause the display to switch between views. For example, zooming in from the tree view may cause the display to transition to the family view. Zooming in further may cause the display to transition to a view focusing on a particular family line, and so forth. Zooming between levels on a touch-screen device may be accomplished through the use of finger gestures. For example, pinching or spreading two fingers in contact with the touch screen may be received as a command to zoom in or out.
In light of this disclosure, it will be understood that there are many different ways to display a genealogical chart. Many of the examples discussed herein disclose an ancestral view of a genealogical chart, wherein the display is focused on an individual, and ancestral lines are arranged to radiate away from the individual. Other views of a genealogical chart may also be used, such as a family view, a descendent view, an individual view, and/or a top-level, tree, or global view. Each of these different views may correspond to one of the detail levels discussed above, or may focus on more than one individual. Therefore, the examples used herein should be viewed as merely illustrative, and the methods for navigating through a genealogical chart are applicable to all forms of genealogical charts, displays, and views that include directional familial lines.
If the genealogical chart is being displayed on a device that accepts finger gestures as an input, these may be used to provide zoom, pan, and rotate commands for manipulating a visual representation of the genealogical chart 100. For example, on a tablet computer, e-reader, laptop computer with a pen input, and/or smart phone, it is possible to use a finger gesture such as dragging a finger across the screen to navigate around the genealogical tree. Likewise, a user could place two fingers on the screen and rotate them in order to rotate the image, or in some embodiments, to rotate around a three-dimensional tree. To zoom the image in or out, two fingers could be pinched or spread apart. These finger gestures can also be performed on a touch pad input device instead of the screen of the display. In absence of a touch device, a device may still accept each type of input action used to zoom, pan, and rotate from another input device such as a mouse, keyboard, and/or the like. These various methods of navigating using a touch-screen device will be discussed in greater detail later in this disclosure.
Returning now to the way records are linked in the chart, the relationship between two records may be more complicated than the adjacent records in the parent-child relationship 115. The relationship between two nodes may span multiple generations and may be comprised of myriad legal and familial bonds. In one embodiment, a genealogical tree structure may represent these more complicated relationships using multiple nodes and interconnecting relationships to form complicated topographies. A complicated relationship may be represented as the sum of a plurality of individual relationships. For example, the relationship between node 110 and node 130a may be comprised of the nodes 110 and 120a and the relationship 115a between them (a parent-child relationship), nodes 120a and 130a and the relationship 125a between them (another parent-child relationship).
Because complex genealogical trees may be comprised of multiple simple relationships, it may often be difficult to display all of the relevant information at the same time on a single display device, particularly a touch-screen device with a small screen. Because a complex relationship may be constructed by multiple individual records and relationships, this relevant information may include biographical, pictorial, audio, video, documentary information, and/or the like for each of the individual nodes in the relationship pathway. Therefore, in accordance with embodiments of the present invention, methods systems are herein discussed that may display an optimal amount of the genealogical tree in such a way that a user can understand its organization and easily navigate the tree on a touch-screen device.
Given this large amount of information that may be stored in a genealogical tree, it may be impractical to display the entire tree at once. As used herein, the term "display" refers to a graphical representation of various genealogical records. This is separate from the physical device used to make the display visible to a user. For example, in one computer system, the display would refer to the graphical information provided to a processor, to be displayed on a touch-screen device. FIG. 2A illustrates a display 200 for a record display program with an exemplary arrangement of icons corresponding to records that are interrelated. The display 200 provides an easy and convenient way to show the relationships between records (i.e., show how the records are connected). Specifically shown in display 200 is a plurality of icons related to genealogical records. Display 200 may be arranged according to a "relationship view," which simultaneously shows an individual's progeny, ancestry, and siblings. In other words, the display 200 is not restricted to one type of view, such as an ancestral view that only shows a person's ancestors, but the display 200 may show any and all relationships linked to an individual together in various combinations on a display device.
The display 200 may include a plurality of icons or avatars, such as icon 220a. Each of the icons may be associated with a specific genealogical record in a database of genealogical records. A computing system may associate each of the records with a specific icon and/or a user can associate each record with an icon. The icon 220a may include a figure that visually represents the associated record. For example, the icons displayed in FIG. 2A shows a profile of a woman's head or a man's head to visually represent the sex of the individual associated with the genealogical record. The icons may further be colored to show additional information, such as coloring icons representing females in pink and icons representing males in blue. The icons 210 may further include information about the record that they represent. For example, FIG. 2A illustrates icon 220a as including the name 212 and the birth date 216 of the individual.
The display 200 may include a docking field 202 (shown in dashed lines) that focuses the display 200 on a selected record and/or that displays relationship information for the selected genealogical record (e.g., displays a family relationship for the selected record). The docking field 202 may be a predefined area of the display that is configured to receive an icon and display information for the record positioned in the docking field 202. The display 200 may include a visually defined boundary for the docking field 202 or may generally include an area that a user may or may not recognize as being the docking field 202. FIG. 2A illustrates icon 210 that represents a genealogical record for John Tues as being positioned within the docking field 202. Since this icon 210 is positioned within the docking field 202, the display 200 is focused on the record for John Tues and the type of relationship or connectedness of other records linked to the record for John Tues. Thus, the other icons shown in display 200 are arranged according to their relationship or link with the icon 210 representing John Tues. More specifically, the other icons are arranged according to the relationship or link between the records they represent and the record of John Tues.
The display 200 may include one or more progeny or descendant fields 260 that are linked to the docking field 202. The progeny fields 260 may be configured to display the icons of genealogical records that are the progeny or descendants of the person associated with the record/icon 210 positioned in docking field 202. For example, FIG. 2A illustrates the progeny fields 260 disposed to the left side of docking field 202 and including four icons that represent the children of John Tues. The progeny icons in the progeny fields 260 may be arranged according to birth order with the icon for the oldest child vertically above the other icons and the icon for the youngest children vertically below the other icons. The display 200 may also include one or more spouse fields 250 linked to docking field 202 and configured to display the icon associated with the spouse(s) of the person represented by the icon 210 in docking field 202. The spouse field may be positioned vertically below and slightly horizontally offset from icon 210 in docking field 202.
In some embodiments, display 200 may further include a plurality of sibling fields (not shown) that are linked to the docking field 202. The sibling fields may be configured to display the icons of genealogical records that are the siblings of the person associated with the record/icon 210 positioned in docking field 202. The sibling fields may be positioned vertically above and/or below the docking field 202 so that the icons displayed in the sibling fields 208 horizontally align with the icon in the docking field and are vertically offset from one another. The icons in the sibling fields may be arranged according to a birth order so that the icon for the oldest sibling is positioned above the other icons and the icon for the youngest child is positioned below the other icons. Such an arrangement of siblings may visually illustrate where in the birth order the person represented by icon 210 fits within the family.
Display 200 may additionally include a plurality of ancestral fields 220, 230, and 240 that are likewise linked to docking field 202. The ancestral fields 220, 230, and 240 may be configured to display the icons of genealogical records that are the ancestors of the person associated with the record/icon 210 positioned in docking field 202. The ancestral fields 220, 230, and 240 may be positioned to the right of the docking field 202 so that the parent icons in each generation are horizontally offset from the corresponding child icon and vertically offset above and below the centerline of the child's icon as shown in FIG. 2A.
Each of the icons, such as icon 220b, may also include relationship information 214 that describes the relationship between the icon 220b and the icon 210 positioned in the docking field 202, or more specifically the relationship between the records represented by the icons, 210 and 220b. As illustrated in display 200, the icons in the progeny fields 240 indicate whether the individuals are sons or daughters of John Tues, while the icon in the spouse field 250 indicates that the individual is the wife of John Tues, and the ancestral fields 220, 230, and 240 indicate whether the individual is the father, mother, grandfather, grandmother, etc. of John Tues.
Further, although FIG. 2A shows the ancestral fields 220, 230, and 240 running two generations deep and the progeny fields 260 running one generation deep, it should be realized that the fields and/or icons may be arranged in any configuration. For example, the ancestral field 220 may run one generation deep while the progeny fields 260 run three generations deep, or the ancestral fields 220 and 230 and progeny fields 260 may both run two or three generations deep. Further, the docking field 202 may be repositionable on the display 200 so that a user may reconfigure the display 200 according to need and/or preference. For example, a user may enlarge the area defined for docking field 202 and or reposition it vertically and/or horizontally on the display 200.
From FIG. 2A, it should be clear that ancestral and progeny records may be organized into a generational hierarchy with sequential levels. For example, the parent fields 220 may represent a first level of the generational hierarchy, and the grandparent fields 230 may represent a second level of the generational hierarchy. Because most genealogical tress may extend many generations, the display 200 may include a subset of the levels of the generational hierarchy simultaneously. Therefore a determination must be made as to how many generations levels may be displayed at one time on the display 200 such that enough personal information for each record is displayed while maintaining the context within the larger genealogical tree. Therefore, a display group 270 may be formed to include the graphical information for each record displayed in the touch-screen.
In one embodiment, a predefined number of generational levels may be displayed. For example, a display group 270 having a predefined target number of three generational levels may be formed, comprising the selected record in the docking field 202, the parent ancestral fields 220 and the grandparent ancestral fields 230. The target value may be defined in hardware or software and/or changed by the user. It may also be calculated based on a hardware profile or characteristic, such as available memory, the size of the display, and/or the like.
In another embodiment, instead of being a hard target, the predefined number may instead be a minimum value, a maximum value, or an approximate target. When the predefined target value is approximate or a minimum/maximum, the actual number of generational levels in the display group 270 may be influenced by other factors such as icon display size, total number of records in the relationship, and/or the like. Merely by way of example, a user could decrease the amount of information to be displayed for a record, and this in turn could increase the number of generational levels displayed in each set up to a maximum target number of generational levels. Alternatively, the user could increase the amount of information displayed in each node, and the number of nodes displayed could decrease down to a minimum target number of generational levels.
In another embodiment, the number of generational levels in the display group 270 may depend on a minimum, maximum, or target relationship span. For example, FIG. 2A shows the display group 270 comprised of a number of generational levels wherein the relationship span between the first and last records in the display 200 is a grandparent-grandchild relationship. The relationship span may be a hard number, or it may be an approximate target that is used in conjunction with other display variables to calculate the actual number of nodes in the display group 270.
While the ancestral and progeny records may be organized into a generational hierarchy with sequential levels, they may also be organized into familial lines. For example, at least three familial lines may extend from the John Tues's icon in the docking field 202. The paternal familial line would run through John Tues's father (Ralph Tues Jr.) in icon 220a. The maternal familial line would run through John Tues's mother (Jamie Jesperson) in icon 220b. Finally, a third family line would run through John Tues himself towards his children represented by his children's icons 260. When navigating around the display 200, a user may typically navigate along these or other similar familial lines.
In yet another embodiment, the number of generational levels in the display group 270 may change dynamically as the display parameters are changed. For example, the display group 270 containing three generational levels may be reorganized to contain more than three generational levels if a user provides a command to zoom out the display 200. As another example, a user may set the display 200 to show a particular subset of the genealogical records simultaneously on the display screen. The number of generational levels in the display group 270, the span of the relationships in the display 200, or some other variable based on the user selection may be used as a basis for organizing or reorganizing the display group 270. The same process for dynamically sizing the steps in the sequence described above could be used in response to any change in the display, such as panning, zooming, changes in resolution, changes in display size, and/or the like. It should be appreciated in light of this disclosure that these methods of determining a number of generational levels to include in the display group 270 are merely illustrative, and that other combinations and variations of these techniques for doing such may be used in other embodiments.
As stated above, various finger gestures may be used to manipulate the display 200 and navigate around a genealogical chart. Specifically, a finger gesture may be used to replace icon 210 in the docking field 202 with another icon, and rearrange the genealogical records in the display group 270 accordingly. Finger gestures may be used to graphically move the display group 270 in FIG. 2A a number of generational levels to the left or right. In order to provide for a seamless, animated graphical transition between two successive display groups, the records in the next generational levels that are not in the current display group 270 may be prepared for display prior to receiving a user input requesting such. The display information for these groups may be prepared and stored, or "pre-fetched", in a cache memory such that the as the records in the display group 270 are shifted in and out along familial lines, high latency memory operations may be eliminated.
For example, if the display 200 is configured to advance one generational level in either the ancestral or progeny directions in response to a navigation and/or pan command, then the cached display groups 280 may be prepared for display and stored in a cache memory. If the display 200 is navigated in the paternal ancestral direction, then the cached display group 280b could be incorporated into the display group 270 without requiring additional high-latency memory and/or display operations.
FIG. 2B illustrates a transition between different display groups according to one embodiment. For example, if the display 200 received a finger gesture associated with navigating the display along the paternal ancestral line, then the display groups and the docking field could change accordingly. Specifically, icon 220a associated with the record for Ralph Tues Jr. has been transferred from the ancestral field (specifically the father field) into docking field 202. As icon 220a transfers into docking field 202, the other icons in display 200 may transfer into one or more fields based on the relationship between the records of these icons and the record of icon 220a, which is now the focus of display 200. For example, icons 240a and 240b, which represent the respective father and mother records of Ralph Tues Jr. (icon 220a) may transfer from grandfather and grandmother fields to father and mother fields based on a father and mother relationship with the record represented by icon 220a. All moving icons may appear to move simultaneously with or near simultaneously with icon 220a so that the context of the relationship is maintained.
One way to keep the relationship context intact is to transition or transfer all the icons simultaneously or nearly simultaneously so that it appears to a user that all the icons transfer/shift at once while maintaining a linked arrangement. Maintaining a linked arrangement may include maintaining spatial dimensions between icons so that it appears as if the icons are physically linked together. Another way to keep the relationship context intact is to transfer, transition, or otherwise shift and move icons without refreshing or redrawing display 200, which helps keep the focus and attention on the icons and relationships between icons/records. The transfer or replacement of an icon in docking field 202 changes the focus of the information and relationships in display 200 from the record for the transferred or replaced icon to the record for the new icon. For example, the sibling, ancestral, and/or progeny links may change to reflect the shift in focus to the new icon positioned in docking field 202. If these fields were not previously in the display group 270, they could be thereafter be included.
Similarly, any siblings fields and docking fields may transition to the progeny fields due to these icons representing the children of the Ralph Tues Jr. (represented by icon 220a). Likewise, icon 210 representing John Tues may transition out of the docking field 202 so that the focus of display 200 is shifted from the record of John Tues to the record of Ralph Tues Jr., or any other record that is positioned within docking field 202. As previously described any sibling icons may transfer or transition simultaneously with or nearly simultaneously with icon 220a so that the transition is visually seamless or substantially visually seamless to a user and the context of the relationship is maintained.
As the focus of display 200 shifts from the record of icon 210 to the record of icon 220a, one or more records may be transitioned or transferred off display 200. For example, the progeny icons 270 may be transferred from the progeny fields so that the icons are no longer visible on display 200. This may be due to the user configuring display 200 to only display one generation of descendants. Similarly, icons 230c and 230d, which represent the father-in-law and mother-in-law of the record of icon 220a may be transferred from the ancestral fields so that these records are no longer displayed because there may be no ancestral relationship between these records and the record of icon 220a.
Similarly, icons representing records that were not originally displayed in FIG. 2A may be transferred or transitioned into the display 200. For example, the grandparent records 245 linked to the record of icon 220a may be transferred onto display 200 so that the previously un-displayed grandparent icons of Ralph Tues Jr. may be subsequently displayed. FIG. 2B illustrates the previously un-displayed icons repositioned in the grandparent fields replacing icons 240. Likewise, previously un-displayed sibling icons of Ralph Tues Jr. (not shown) may be displayed as well, and may be transferred onto display 200 and subsequently populate the respective sibling fields based on their relationship to the record of icon 220a. Further, the replaced icons may transfer to new fields and/or on or off display 200 simultaneously or nearly simultaneously to provide a visually seamless transition and thereby keep the relationships between the records in context during the transition. Additionally, display 200 may curve hyperbolically toward the edges of the display so that icons transferred on and/or off display 200 curve behind one another toward the edge of the display thereby enabling several generations of icons to be visible toward the display's 200 edge.
Transferring icons to and from the docking port 202 may occur in a variety of ways, such as through scrolling, selecting and dragging an icon, moving an imaging device, etc. For example, a user may use a scroll button to scroll between records displayed in docking field 302 or may place a finger and/or mouse pointer on a display device (e.g., a selectable LCD screen) and scroll through records displayed in docking field 202 by dragging the finger and/or mouse pointer across the display device. The user may move a finger and/or mouse pointer vertically as well as horizontally to navigate between records, such as by dragging a finger diagonally up and right to transfer icon 220a to docking field 202. In this manner, a user may quickly and conveniently scroll through numerous records and across multiple generations (forward and backward) by merely positioning a mouse pointer. If the record database is large, the user may further quickly and conveniently scroll horizontally through multiple generations and scroll vertically through multiple family lines so that the displayed record at the end of the scrolling session is tenuously related to the record displayed at the beginning of the scrolling session.
In addition to scrolling, the user can position icons in the docking field 202 by selecting an icon from one of the fields and dragging the icon to the docking field 202. For example, icon 230a representing Ralph Tues Sr. may be selected and dragged from the father field to the docking field 202 so that the focus of the display 200 is transferred to the record of icon 230a. The transfer or transition of the icons between fields and/or on or off the display 200 may occur simultaneously or near simultaneously as described above.
The description continues in the full USPTO document.
About 6,358 words. The USPTO PDF has it with every drawing.
Fees are due 3.5, 7.5 and 11.5 years after grant. This patent expired on July 1, 2026, so the fee marked "not paid" was the one that went unpaid.
METHODS AND SYSTEM FOR DISPLAYING PEDIGREE CHARTS ON A TOUCH DEVICE
Filed Dec 2011 · published Jun 2013Methods and system for displaying pedigree charts on a touch device
Filed Dec 2011 · granted Jul 2014Earlier publications, parents and continuations. None of them can still be enforced, or this patent would not be listed.
Prior art cited by the examiner or applicant. Useful when you check your own idea for novelty.
Everything on this page comes from the documents linked above.