Cross-reference to related application(s)
This claims priority to Mexican Patent Application No. MX/a/2014/015591, filed on Dec. 17, 2014, the entire contents of which are fully incorporated herein by reference.
Technical field of the invention
The present invention refers to a procedure: a) To determine the three dimensional morphology of micro and nano-cavities, as produced by chemical and/or biological corrosion in metallic materials, as well as the effective advance of the corrosion, the true length of the corrosion cavities and their associated parameters: vector field of corrosion, intensity of corrosion and the diameter/true-length ratio of corrosion by applying volumetric, gravimetric and analytic formulations and techniques of scanning electron microscopy (SEM). b) To quantitative determine the rate of chemical and/or biological corrosion growth in metallic materials derived from their volumetric and gravimetric properties; and c) To develop a graphic interface to access the numerical information and micrographs in a simple, user-friendly manner. 1.
Background
Corrosion is generically defined as the degradation of a metallic material through its interaction with its surrounding environment. A primary classification of this degradation, which occurs on the material's surface, is heat-dry, i.e. corrosion due to hot gases and humidity due to electrolytes in solution.
One type of aqueous corrosion involves the reaction of a metal surface with an electrolyte, also known as electrochemical interaction; this reaction produces a deterioration of the metals physical and chemical properties, which in turn accelerates its aging and destruction.
A relevant issue in this kind of corrosion phenomenon is the metal/electrolyte interaction. Here, an anodic dissolution of metals and the corresponding cathodic reduction takes place, producing a redox reaction this way. What also happens is the adsorption and formation of oxide layers, which can significantly reduce the corrosion rate by the inhibition of the chemical reactions existing in the corrosion process. The electrolyte is the place in which the subsequent chemical reactions take place, and the migration and diffusion of the corrosion byproducts and species involved in the corrosion process occur.
Another important mechanism responsible for corrosion is that induced by microorganisms (MIC), which is a process where microorganisms are involved (bacteria, fungus, algae); they either initiate, facilitate or accelerate the corrosion process. In the USA, the cost of corrosion affectation represents 3.1% of the gross domestic product of the country, and 40% of the internal corrosion in oil industry pipes is attributed to microbial activity.
The states of stress and deformation of materials also play an important role in corrosion phenomena. Different types of corrosion may occur depending on the redox reactions at the metal surface. Here, two types of corrosion are classified into those with and those without mechanical stresses involved.
Pitting corrosion involves no mechanical stress. It is especially observed in austenitic stainless steels in the presence of certain anions in electrolytes (chlorides and bromides). Pitting corrosion is caused by the local destruction of the passive protective layer of the metal with the formation of a small corrosion anode (pit). For low carbon content steels, pitting corrosion is commonly caused by the presence of sulfides in the alloy, combined with the action of bromide and/or chloride anions, which produces a low pH environment in the volume around the pit, further accelerating the corrosion process. Corrosion by erosion, on the other hand, does involve mechanical stresses and is observed in pipes transporting liquids. This type of corrosion appears when the flow speed exceeds a certain limit, due to local turbulence, or when there is formation sand flowing in the fluid. In this corrosion phenomenon, the passive surface of the metal is detached by the flow, leaving the metal bare, uncovered and susceptible to corrosion by the transported liquid.
Techniques for Corrosion Measurement
Various techniques exist for the measurement/analysis of corrosion, each based on different physical, chemical and biological phenomena, and aimed to obtain specific information to describe the corrosion in the studied system. Table 1 presents a non-exhaustive classification of corrosion tests based on the information and technique used.
TABLE-US-00001 TABLE 1 techniques and tests to measure corrosion Classification Information/technique Tests based on emission of Ultrasound signals: acoustic, magnetic Acoustic Emission and electrical current Eddy Current/Magnetic Flux Smart pigs Chemical, biochemical and pH Measurement microbiological analyses Gas Dissolved (O.sub.2, CO.sub.2, H.sub.2S) Metallic Ions counting (Fe.sup.2+, Fe.sup.3+) Microbiological Analysis Information of the operation Temperature Velocity or Flux rate change Pressure pH Electrochemical techniques Potential Measurement. Potentio-static Measurement. Potentio-dynamic Measurement. A.C. Impedance. Monitoring in the corrosion Corrosion Coupons environment. Biocoupons or bioelements Electric Resistance Linear Polarization Hydrogen penetration. Galvanic Current Sand erosion monitoring Techniques based on Radiography electromagnetic signals Thermography. processing. Laser profilometry. 2D Scanning electron microscopy. Transmission electron microscopy. Atomic force Microscopy Optic Microscopy. Ellipsometry.
Tests Based on the Emission of Acoustic, Magnetic and Electric Current Signals.
These tests are based on the emission and/or reception of: acoustic signals of low and ultrasonic frequencies, electrical current and magnetic fields. By their nature they are known to be non-destructive and require devices to emit and/or capture these types of signals. The information obtained includes; detection of the existence and depth of cavities within the materials and the determination of the corrosion affected surface morphology in three dimensions, although the detection of a pit depth is limited to the depth that the signal can reflect back to a detector, thus restricting the information on the true shape of the cavity.
Chemical, Biochemical and Microbiological Analyses
These tests are based on the measurement of existent elements which allow, cause or are byproduct of corrosion in metallic surfaces. There exist both; laboratory and field quick tests. These tests mainly determine pH, dissolved gases content, presence of metallic ions, sulfate-reducing microorganisms, reducers of Fe and Mn, oxidizers of sulfur, fermenters and producers of exopolym ers.
Information of the Operation.
This information provides direct or indirect evidence of the existence of areas subject to corrosion; among them are the velocity or change in flow velocity, existing thermal gradients, pressure or pressure gradient and the acidity/alkalinity of the flow environment.
Electrochemical Techniques
These techniques are based on the electric potential difference between two or more electrodes in the metal, which is affected by the corrosion between them. In this way, through the analysis of the potential decay on a metal surface, one can produce a map of position and extent of the corrosion.
Corrosive Environment Monitoring.
Monitoring of corrosion is vital to the oil and gas industry. It permits preventive and corrective actions to be carried out, avoiding much greater potential losses. In “Corrosion in the oil industry”, Oilfield review, Shlumberger V6
April 1994, Brondel, E. et al describe techniques of corrosion monitoring in the petroleum industry.
Gravimetric monitoring techniques of the corrosive environment are based on the measurement of average corrosion using corrosion coupons. A coupon mass is weighed before and after exposure to the corrosive environment; in this way it is possible to obtain the percentage of material lost over a known period of time. The methodology for the preparation of the test mass samples and the subsequent evaluation of the corrosion by this technique is documented in ASTM G1-90
“Standard Practice for Preparing, Cleaning, and Evaluating Corrosion Test Specimens”.
Biocoupons or bioelements, on the other hand, permit, after being exposed to the corrosive environment in the field, the extraction and identification of biological entities that induce corrosion. This is achieved through the application of traditional microbiological techniques or molecular biological methodologies. On the other hand, it is possible to determine the characteristic morphology of the microbiological corrosion which presents itself as small pits of varying depths and can cause damage and fracturing of metallic materials. Techniques of electron microscopy are used for the analysis of this type of corrosion.
Measurement of the lineal polarization resistance. This method quantifies the polarization resistance of an electrode exposed to a corrosive environment in order to determine the corrosion electric current. By considering the linear voltage-current response of a corroded element over a small range of values, the gradient of the linear section is the polarization resistance. This resistance is inversely proportional to the corrosion current, thus allowing calculating the rate of corrosion.
With respect to this technique, it has been reported that the addition of Nitrogen enhances the resistance to pitting corrosion in austenitic steels, reducing the potential of pitting corrosion in chlorine solutions or diminishing the mass loss in immersion tests in FeCl.sub.3. Therefore the presence of nitrogen is an important indicator of these materials resistance to pitting corrosion.
Electrochemical potentials. Pitting corrosion is also studied by electrochemical potentials and optical images. It allows evaluating this kind of corrosion and galvanic behavior of highly austenitic stainless steel alloys.
Method of Eddy Currents. This measurement technique is based on changes in the impedance of a sensor coil, due to defects in the material continuity, as an electric current passes through the material. This technique is especially useful for detecting small fractures or pits. Devices using the eddy current method have been used to identify and quantify intergranular corrosion (DOS) and the sensitivity of specimens of stainless steel (AISI 316) to this type of corrosion. The categories of sensitivity are based on “fracturing severity” after a bending test. They are, in increasing order: test specimen unaffected, fissured, fractured and broken. It has been observed that the amplitude of the Eddy currents increases with DOS.
Erosion of pipes by sands flow can be quantitatively estimated through expressions that involve velocities and angles of impact, density and ductility of the materials involved.
Techniques Based on Electromagnetic Signals Processing
These techniques are based on the use of electromagnetic radiation to analyze the morphology and composition of a sample. The precision of the obtained signals differ depending on the wavelength of the radiation utilized. Visible light radiation is exploited in both, optical microcopy and ellipsometry. Monochromatic visible light in the form of laser radiation, both in fixed and mobile devices, permits scanning of the surface of a pipe or sheet of metal in a way analogous to the acoustic technique. It is possible to use these techniques to measure the thickness of a passive oxide layer or to obtain the topography of a surface. Laser confocal microscopy allows to study the microorganisms existing within a corroded area. By scanning electronic microscopy, a beam of electrons interacting with the atoms of a material allows to define with great precision the corroded surface morphology. Structural and atomic composition of a specimen can be characterized in standalone spectrometers or spectrometers associated to electron microscopes. Electromagnetic radiation in the X-ray range permits the identification of the elements and compounds that make up a specimen attacked by corrosion.
Thermographic systems make use of radiation in the infrared to detect electrical systems that have experienced corrosion; the increase in electrical resistance of the damaged connections causes an increase in the local temperature around them
Corrosion in the Oil and Gas Industry
Corrosion in the oil and gas industry is present in nearly every component of every stage, from exploration and exploitation of hydrocarbon deposits to refining and production of the oil and gas derivatives. Table 2 presents a non-exhaustive list of conditions of corrosion and their potential solutions.
TABLE-US-00002 TABLE 2 Causes of corrosion in the oil and gas industry Cause of corrosion Methods of prevention and mitigation Corrosion of surface equipment Protection with zinc-rich paints, use of due to rain, condensation and inhibitors, biocides, cathodic protection. sea-breeze dispersion in Cleaning pigs, spheres, moisture traps presence of oxygen. and use of sleeves. Corrosion products and pitting in internal and external piping surfaces. Corrosion in the sea wave zone Overdesign of metallic elements thickness, use of anti-corrosive coatings and installation of cathodic protection systems with sacrificial anodes. Overloads due to the Modeling and inclusion of these loading accumulation of crustaceans states and forces in the structural design and algae, waves pounding and to mitigate the losses due to corrosion. accidental loads of low frequency, tides and operational loads, cavitation effects. Increased pitting corrosion under induced stresses enables the propagation of fractures leading to structural failure. Corrosion of drilling bars. Structural supports of self- Cathodic protection, removing agents elevating platforms, immersed containing sodium chromate, zinc ducts, distillation towers chromate and sodium nitrate to remove attacked by sulphate reducing the H.sub.2S. bacteria (SRB). Inhibitors of bio-films, such as triazine- Water injected for secondary based compounds are used as biocides production, together with for controlling bacteria. formation water cause corrosion in the steel pipes due to the high concentration of salts such as chlorides and the presence of hydrogen sulfide, the origin of which is microbiological. Galvanic corrosion due to the Cathodic protection. union of two or more elements composed of different metals.
Corrosion monitoring is very relevant for the oil and gas industry since it allows for preventive and corrective actions to avoid big financial losses. In “Corrosion in the oil industry, 1994” Brondel, E. et al, 1994 “Corrosion in the oil industry”. Oilfield Review: 6(2), the authors describe some corrosion monitoring techniques in the hydrocarbon industry.
Microscopy Based Characterization of Pitting Corrosion
These types of corrosion have been studied with various microscopy techniques: Optical microscopy helps to determine the presence or absence of corrosion films and cavities caused by pitting. In the latter case, it permits the measurement of the cavities surface areas in the material and therefore allows determining the statistical distribution of those cavities surficial diameters. In addition, it permits the identification of coalesced and/or isolated cavities and their distribution on the metal's surface, as well as to identify surface fracture patterns; it also helps to determine the existence of inclusions and defects and, by manipulating the focus, allows making a rough estimate of the depth of pits.
Raman microscopy allows the identification, by spectroscopy analysis, of the specific chemical species produced in the corroded material. It also helps to study dynamic systems, such as the phenomenon of transport and distribution of chromates to active pits and the consequent formation of corrosion products on different timescales, from milliseconds up to several days. It also allows the determination of the chemical nature of these products by comparing their spectra with other spectra from known synthetic materials.
Scanning electron microscopy (SEM) provides additional advantages over the capabilities of light microscopes for the characterization of pitting corrosion. These instruments have a far greater resolution, down to 2 nm even under low vacuum; their magnification capabilities above 1,000,000× are unrivalled; all these features combined with its large focal depth made of SEM a standard tool in metallurgical science. Supported on their peripheral spectroscopy and nanomanipulation systems, these instruments help to identify the origin of the corrosion by noting the type of corrosion, the deposits found in the attacked area and the corrosion byproducts. For example, the presence of microorganisms, preserved in Glutaraldehyde, can be studied by electronic microscopy. The use of SEM in the characterization of pitting corrosion has evolved with the advent of new tools and techniques. Table 3 depicts the evolution on the characterization of this corrosion form using scanning electron microscopes.
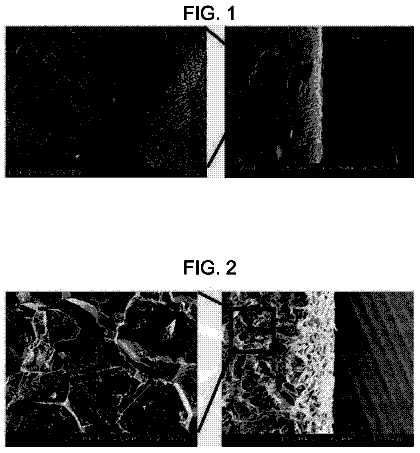
TABLE-US-00003 TABLE No. 3 Evolution of the characterization of pitting corrosion using scanning electron microscopy (SEM). SEM technical features availability Electron microscopy Output Field-emission SEM and secondary surface corrosion micrographs, FIG. No. 1 .sup.
electrons SEM with backscattered electrons detector surface corrosion micrographs with phases identification and microstructure, FIG. No. 2.sup.
SEM and probe microanalysis (EPMA) Identification and concentration of elements, FIG. 3.sup.
SEM with secondary electrons Observation of the pitting corrosion spread, by tilting the stage, at the specimen edge. FIG. No. 4.sup.
SEM with secondary electrons Observation of the pitting corrosion morphology by physically sectioning the specimen, FIG. 5.sup.
Field emission Dual-Beam SEM with ion Observation of pitting corrosion morphology by and electron beams and micro EDS. sectioning the observation area with an ion beam, FIG. No. 6.sup.
Dual-Beam SEM with field emission and Observation of the interface of corrosion products on electron beam steel in an ion-beam sectioned area, FIG. No. 7.sup.
Field emission Dual-Beam SEM with ion Spatial characterization of elements existing at the and electron beams and micro EDS. pitting corrosion zone, FIG. No. 8.sup.
Tunneling microscopy with an In-situ electrochemical studies with topographic electrochemical unit, under controlled characterization and phase identification, before and environmental conditions. after the corrosion attack, FIG. No. 9.sup.(5). FIG. No. 9 in section A shows the surface initial conditions and, section B shows the same surface after two cycles of the process.
Table No. 3 shows how SEM techniques for the characterization of pitting corrosion have substantially developed in the last decade, through the arrival of observation in low-vacuum, WDS spectrometry and the inclusion of ion beams in these systems. However, morphological, textural, dimensional and directional characterization of the cavities has not been adequately addressed yet.
Use of Polymers
To the knowledge of the authors, the use of polymers to characterize corrosion pitting in test specimens has not been implemented in the oil and gas industry. N. Chawla et al., in 2003, in their document “Three Dimensional (3D) Characterization and Modeling of Porosity in Powder Metallurgy (P/M) Steels” utilized a technique involving epoxy resins to study the porosity of metallic alloys. Here, they describe a procedure involving microscopy imaging of a steel specimen previously impregnated with resin; afterwards, it was sequentially polished and photographed. The outcome was a series of images, which were integrated together by reconstruction software to obtain a digital object in three dimensions. One of the limitations of this procedure is the necessity for interpolation between each image, which smoothes out the porosity texture and thus does not correctly reproduce the original porosity system; In addition, an optical microscope was utilized to obtain the images; this limits the resolution, magnification and ultimately, the images precision.
According to the state of art, little have varied the procedures for polymer injection, this is particularly true in the morphological study of the pores present in rocks as can be observed in Pittman, E. D., y Duschatko, R. W. 1970 paper: “Use of pore casts and scanning electron microscope to study pore geometry”, Journal of Sedimentary Petrology. 40(4), 1153-1157). In the case of metals, the direct application of polymeric molds has been focused on the morphological characterization of the microporosity of fabricated alloys. However, nothing has been done to determine the morphological properties of a metal exposed to corrosion on the micro and nanometric scales and to quantify their corrosion rate. The advantages of using polymeric resins to obtain molds of the cavities caused by corrosion, is that the morphology of these cavities can be studied in great detail in three dimensions; in fact, the precise shapes of the micro- and nano-cavities, which cannot be obtained and measured by the aforementioned methods can be determined using this technique. For example, in the use of ultrasound or scanning laser methods, the maximum accessible depth depends on the orientation of the cavities with respect to the sensor; this fact limits the maximum depth that those devices can reach. In addition, the cost to acquire transversal sections by ion beam cutting, in terms of time and effort, is very high compared to the benefits; the morphological and dimensional information that can be obtained with this technology is limited by restrictions similar to those discussed for Chawla's work. Additionally, the period required to obtain one image at the dozens of micrometers scale may be very long or not possible to obtain and, if not properly carried, curtaining effects during milling may be a drawback (Table 3). Other techniques have similar limitations.
Tomographic analysis by X-rays is limited to the range of tens of micrometers and its resolution is insufficient to reconstruct, with high fidelity, even the texture of the corrosion walls of a specimen attacked by corrosion (Freire-Gormaly, M., MacLean, H., Bazylak, A. 2012 “Microct investigations and pore network reconstructions of limestone and carbonate-based rocks for deep geologic carbon sequestration.” Proceedings of the 6th International Conference on Energy Sustainability Conference, ASME2013, July 23-24, San Diego, Calif., USA; Chawla, N., Williams, J. J., Deng, X., McClimon, C., 2009 “Three Dimensional (3D) Characterization and Modeling of Porosity in Powder Metallurgy (P/M) Steels.” International Journal of Powder Metallurgy. 45(2)).
Furthermore, in the case of controlled conditions such as those where corrosion coupons and biocoupons are used, a more precise, economic and rapid determination of the corrosion's advance is possible using the technique outlined in this invention, compared to the techniques based on laser and ultrasound signals.
The aforementioned technologies used for morphological and morphometric characterization of pitting corrosion with corrosion coupons and microbiological induced corrosion with biocoupons, based on various microscopy methods, known by the patent applicants are surpassed by the present invention. None of the cited references integrally relates with a procedure for three dimensional morphological characterization of micro-y nano-cavities by SEM and the quantitative determination of the effective corrosion of metallic specimens.
It is therefore an objective of the current invention to provide of a new technique for the three dimensional morphological and morphometric characterization of micro- and nano-cavities caused by pitting corrosion on corrosion coupons and biocoupons. The technique is based on acquiring a polymer mold of these cavities inside a device called “Constant-volume Injection Chamber” (CIVC). The resin employed can be polyacrylic, polystyrenic, polyvinyl o epoxy. The foregoing includes determining the shape, dimensions and distribution of the net of cavities produced by chemical and/or microbiological induced corrosion, applying SEM techniques.
An additional object of the present invention is a procedure to quantitatively determine the effective corrosion of metallic specimens, derived from their volumetric and gravimetric properties in controlled volume and temperature conditions.
The aforementioned objectives and other objectives of the present invention will be more detailed and clearly stablished in the following chapters.
Bibliography
Vaidya, R, U., Hill, M. A. Hawley, M., Butt, D. P.
“Effect of Pitting Corrosion in NaCl Solutions on the Statistics of Fracture of Beryllium.” Metallurgical and Materila Transactions A. 29A. November. 2753-2760.
Fraser, H. L., Mills, M. J., Buchheit, R. G., Wang, Y., Ghosh, S., Williams, J. C., Frankel, G. S. Rollett, A. D. Grandt, A. F.
“accelerated metals development by Computation” Air Force Research Laboratory Materials and Manufacturing Directorate Wright-Patterson Air Force Base, OH 45433-7750 Air Force Materiel Command United States Air Force. Report AFRL-RX-WP-TR-2008-4176.
Romero, D., J.
“Corrosion microbiana aerobia en el interior de acueductos de la industria petrolera.” Doctorate Thesis. Facultad de Química, Universidad Nacional Autonoma de México. México.
Halvarsson, M., Tang, J. E., Asteman, H., Svensson, J.-E., Johansson, L.-G. 2006 “Microstructural investigation of the breakdown of the protective oxide scale on a 304 steel in the presence of oxygen and water vapour at 600° C.” Corrosion Science 48: 2014-2035.
“In situ electrochemical SPM for energy and corrosion studies” American Laboratory, 17. August 2013.
Brief description of the invention drawings
FIG. 1 . Surface corrosion micrograph
FIG. 2 . Surface corrosion micrograph with phase identification and microstructure.
FIG. 3 . Identification and concentration of elements.
FIG. 4 . Observation of the pitting corrosion spread, by tilting the stage, at the specimen edge.
FIG. 5 . Observation of the pitting corrosion morphology by physically sectioning the specimen.
FIG. 6 . Observation of pitting corrosion morphology by sectioning the observation area with an ion beam.
FIG. 7 . Observation of the interface of corrosion products on steel in an ion-beam sectioned area.
FIG. 8 . Spatial characterization of elements existing at the pitting corrosion zone
FIG. 9 . In situ topographic characterization of different materials before and after being attacked by corrosion.
FIG. 10 . Schematic illustration of the parameters: Effective advance of the corrosion (AEC), true length of the corrosion (LRC), equivalent diameter of the cavity (DEC)
( DEC = 4 A π ) , and the corrosion vector in a stainless steel specimen.
FIG. 11 . Schematic illustration of the placement of corrosion specimens and their relative orientation.
FIG. 12 . Schematic illustration of a Teflon protector.
FIG. 13 . Schematic illustration of the location of the Teflon protector, the coupon and their together assembling.
FIG. 14 . Schematic illustration of the Constant-volume Injection Chamber (CIVC) with corrosion coupon.
FIG. 15 . Schematic illustration of the Constant-volume Injection Chamber (CIVC) with a bio-coupon.
FIG. 16 . Schematic illustration of the Constant-volume Injection Chamber (CIVC) with polymer injected into the coupon.
FIG. 17 . Schematic of the polymer and coupon together.
FIG. 18 . Schematic of the polymer and coupon illustrating the polymer inside the cavities caused by corrosion.
FIG. 19 . Steel coupon during the dilution process.
FIG. 20 . Polymer mold of cavities.
FIG. 21 . Mold on a SEM specimen holder.
FIG. 22 . Device for gold sputtering.
FIG. 23 . Specimen mounted on a SEM sample holder and covered with a gold thin film.
FIG. 24 . Corrosion coupon after being subjected to pitting corrosion and radial sector of this coupon in cylindrical coordinates.
FIG. 25 . Polar rectangle (R) divided into differential polar subrectangles and, center of the polar subrectangle Rij.
FIG. 26 . Schematic of a radial section of a coupon, from r=a to r=b and an associated differential polar element.
FIG. 27 . Schematic of a differential polar element of steel attacked by corrosion. The grey section is the remaining steel after the attack.
FIGS. 28 and 29 . Micrographs show the true morphology of the voids caused by pit corrosion. The images were captured with the electron beam perpendicular to the specimen plane.
FIGS. 30 and 31 . Micrographs show the true morphology of the voids caused by pit corrosion. The images were captured with the electron beam tilted 35 degrees with respect to the specimen plane.
FIGS. 32 through 35 . Micrographs show textural properties of the steel walls attacked by corrosion.
FIGS. 36 through 39 . Micrographs show measurements made on diameters, lengths and spread angles of cavities caused by corrosion.
FIGS. 40 through 42 . High-resolution micrographs provide relevant information on the direction the corrosion pitting is advancing in the space of three dimensions.
FIG. 43 . Schematic illustration from both, the laser and ultrasound depth reach at the pits crated by corrosion phenomena.
FIG. 44 . Corrosion coupon before being exposed to corrosion.
FIG. 45 . Picture of the corrosion coupon No. 751 after being attacked by a corrosive liquid flow.
FIGS. 46 through 48 . X-ray diffraction analysis results of the corrosion byproducts.
FIG. 49 . Coupon after being attacked by corrosive liquid flow and before being cleaned.
FIG. 50 . Coupon after being attacked by corrosive liquid flow and cleaned.
FIG. 51 . Conventional high-resolution microscopy pictures of the coupon, showing surface features.
FIG. 52 . Polymer replica of coupon No. 751.
FIG. 53 . Gold sputtered polymer replica of coupon No. 751, showing corrosion pits to be analyzed with SEM.
FIG. 54 . Micrographs of the corrosion cavities obtained with the methodology of the present invention for Example No. 5.
FIG. 55 . Micrograph of a corrosion cavity captured with the electron beam perpendicular to the coupon plane (Elevation view, 0°).
FIG. 56 . Micrograph of a corrosion cavity captured with the electron beam tilted 52° with respect to the coupon plane.
FIG. 57 . Micrograph showing a flat corrosion region surrounding a pit.
FIGS. 58 and 59 . Plots showing histograms of both, the pits and flat-corrosion depth distributions respectively.
FIG. 60 . Micrograph showing corrosion cavities produced by the corrosion attack on the coupon, in the space of three dimensions, corresponding to the sixth section of the graphic interface in this invention.
Detailed description of the invention
The present invention refers to a procedure: a) To Determine the three dimensional morphology of micro and nanocavities produced by chemical and/or microbiological corrosion in metallic materials, along with the effective advance of the corrosion, the true length of the corrosion cavities and their associated parameters ( FIG. 10 ): vector field of corrosion, intensity of corrosion and the diameter/true-length ratio of corrosion, applying SEM techniques and analytic, volumetric and gravimetric formulations; FIG. 10 illustrates the parameters: Effective advance of corrosion (AEC), true length of corrosion (LRC), surface-cavity equivalent diameter (DEC)
( DEC = 4 A Π ) and corrosion vector in a metallic specimen. b) To quantitatively determine the rate of chemical and/or microbiological corrosion in metallic materials based on their volumetric and gravimetric properties; and c) To obtain a user friendly interface to access numeric information and micrographs describing the output of the above determinations.
Specifically, the current invention is related to the laboratory procedures, analytic expressions, devices, processes and calculations required to characterize micro and nanocavities caused by chemical and/or microbiological pitting corrosion in coupons and biocoupons.
The procedure of the present invention is restricted to equipment or elements made of metallic materials prone to be attacked by corrosion, which may be diluted in a hydrochloric acid environment (HCl).
The procedure of the present invention includes the following steps: 1. Reference marks for orientation and weight determination. Whenever possible, it is recommended to place marks on the specimen in order to orientate it with respect to the medium in which the corrosion occurs. This will allow establishing the position of the corrosion vectors field, if it exists, with respect to the medium ( FIG. 11 ), when the corrosion micrographs are analysed. This may be useful if the environment is fluid flowing inside a pipe. Then the specimen weight is determined. FIG. 11 illustrates the relative position of corrosion coupons and their relative orientation. 2. Metallic coupons preparation. This preparation includes dimensions measurement and weighing. In addition, Teflon protectors will partially cover metallic coupons so that these may be attacked on the exposed surface. These protections eventually will help to accurately integrate the specimen-attacked volume. FIG. 12 presents a schematic of the Teflon cover and FIG. 13 shows a specimen of the said protector positioned on the coupon. 3. Corrosion testing or attacking. The biocoupon or corrosion coupon and Teflon cover are installed in the equipment or metallic element to be monitored, then the corrosion test is carried, if possible exposing only one surface of the specimen to the corrosive environment ( FIG. 13 ). 4. Specimen cleaning and drying. After being corrosively attacked, and to accurately observe texture details and measure characteristic distances within the cavities, it is required that the coupon may be free of corrosion by-products and other substances as well as completely dry. The specification for this cleaning can be found in the standards, provided by PEMEX, NRF-194-PEMEX-2007 and NRF-005-PEMEX-2009 or by other institutions, such as ASTM G1-90 (reapproved 1999), or NACE Standard RP0775-2005 as specified. 5. Obtaining a replica of the corrosion cavities. To obtain a replica of the corrosion cavities, these are penetrated, under high vacuum pressure, by a polymer, which is placed in a vacuum chamber along with the coupon; after the catalytic reaction is completed, the metal coupon is dissolved leaving behind a high fidelity copy of the said cavities. The remnant is a three dimensional mold of these cavities. 5.1 Insertion of the specimen into the CIVC. To obtain the mold of the corrosion cavities the coupon is inserted into the chamber called the “Controlled-Volume Injection Chamber (CIVC)”; this chamber is titanium or stainless steel made. For this purpose, the base of the chamber is removed and the coupon introduced ( FIGS. 14 and 15 ). In the description that follows, the same process applies for bio-coupons. The CIVC includes lower and upper caps, and two valves or gates in the upper cap. The largest valve (C1) allows to pour fluids into the the CIVC and the shortest (C2) allows to both, vent gases and liquids out of the CIVC and observe when the chamber is completely filled. FIGS. 14 and 15 show schematics of the CIVC with a coupon and biocoupon inside respectively, were: C1 and C2 are the valves or gates on the CIVC for the fluids flow, and V.sub.CA is the known volume inside the CIVC. 5.2 Polymer injection. Once the attacked coupon is inserted, the complete system (CIVC and coupon) is installed inside a high vacuum chamber, which is hermetically sealed and then subject to vacuum pressure. Inside this chamber, the polymer fills into the CIVC; Valve C2 permits to know when the chamber is full ( FIG. 16 ). FIG. 16 shows a schematic view of the CIVC and the polymer impregnating the coupon. The polymer used is mainly an acrylic, styrene, vinyl or epoxy type of resin. The density of the resin used is determined (ρ.sub.r). This step finishes when the resin used polymerizes. 5.3 Extraction of the specimen from the CIVC. The coupon and polymer are extracted from underneath the CIVC, and then it is washed, weighed and prepared for the process of dissolving the metal ( FIG. 17 y 18 ). FIG. 17 shows a schematic view of the polymer and coupon together, while FIG. 18 shows a schematic view of the coupon and the polymer inside the pitting cavities, where: V.sub.TR the resin total volume; V.sub.1 y V.sub.2 the known volumes of valves C1 and C2, respectively; V.sub.CR is the attacked volume of Steel; and V.sub.REA is the metal remaining volume. 5.4 Dissolution of the specimen. The polymer-injected steel coupon to be dissolved is placed into a precipitation glass and submerged in concentrated hydrochloric acid (HCl), ( FIG. 19 ). FIG. 19 shows a metallic coupon during dissolution. The result of this process is the volume, in resin, of the CIVC control chamber plus the volume of the metal already attacked (Grayest section in FIGS. 17 and 18 ). 6. Washing and drying of the corrosion-cavities replica. What remains, once the metal coupon has been dissolved, is the three dimensional replica of the corrosion cavities, impregnated with residues of hydrochloric acid. It must be cleaned to eliminate said acids and whatever solid residue remains. The washing is performed as follows: Place the replica into a Petri dish. Gently drip ionized water onto the replica to minimize the risk of damage to the fragile polymer copy of the cavity structure. After the specimen has been carefully washed, it is placed into a desiccator for at least a day to ensure there are no remaining drops or thin films of water. The final output is the morphology of the cavities caused by corrosion represented in a polymer mold as illustrated in FIG. 20 . 7. Mounting the mold on a SEM sample holder. The resin mold is attached to an aluminum SEM sample holder or stub, with doubled sided carbon tape as illustrated in FIG. 21 . This sample holder permits to handle the sample and introduce it into the scanning electron microscope. FIG. 21 Shows the mounting of the resin mold on the SEM sample holder. 8. Gold sputtering of the resin mold. In this step. The specimen already contains a polymer replica of the structure of the cavities caused by corrosion. In order to study details of this structure by SEM, it is necessary to coat it with a thin film of electron conductive material such as carbon, gold or gold-palladium ( FIGS. 22 and 23 ). FIG. 22 Shows the gold sputtering device and FIG. 23 shows the replica already covered with a thin film of gold and installed on a SEM sample holder. 9. Observation by Scanning Electron Microscopy (SEM). Once it is coated, the resin replica is ready to be introduced into a SEM vacuum chamber to determine the shapes of, measure the dimensions of and identify the cavities of the sample as well as any trend in their orientation within the steel coupon. More micrographs of pitting corrosion cavities examples, as obtained by SEM, will be presented in further sections. 10. Obtention of the amount of attacked metal and volumes calculation. FIG. 24 helps to explain how the determination of the amount of attacked metal and volumes calculation are made. This figure shows s schematic of a corrosion coupon after being attacked by pitting corrosion; it also shows a radial sector of the coupon inside a polar coordinate system. Let R be a region in polar coordinates, defined by: T ={( r,θ,z )| a≤r≤b; 0≤θ≤2π; 0≤ Z≤t}
Subdividing R into a mesh of elements (differential elements), such that a differential element of this region is R.sub.ij (center of the differential element) as shown in FIG. 25 .
FIG. 25 illustrates a schematic drawing of a polar rectangle (R) divided into differential elements and the center location of polar element R.sub.ij.
The description continues in the full USPTO document.