Lapsed, fee not paid8 drawings
Medical Devices · US 9,844,669 B2
Cosmetic iontophoresis system
Iontophoretically administering a cosmetic agent requires an active electrode and a return electrode secured to the skin ( 150 ).
US 9,846,939 B2 · Assignee: FUJITSU LIMITED · Inventors: Ishihara; Masaki et al.
Sheet 1 of 20 from the published document. All sheets in the USPTO PDF
A method includes displaying a first image including a living body on a display apparatus, accepting specifying of a first area on the first image, extracting a first feature point group from an area in the first image, the area being located in a distance more than a threshold from the first area, acquiring a second image including the living body, the second image being captured at different timing from the first image, extracting a second feature point group corresponding to the first feature point group, from the second image, generating, by a processor, transformation information based on a positional relationship between the first feature point group and the second feature point group, for carrying out an image registration between the second image and the first image, executing transformation processing by applying the transformation information to the second image, and displaying a third image generated by the transformation processing.
In a medical scene, a doctor often compares computed tomography (CT) images captured at different times for determination of the course of a disease of a patient and so forth. At this time, if the compared region is a lung or the like of the patient, position variation due to heartbeat and breathing is included in the CT images. Thus, for example, image registration is carried out by transforming the image about a specified area in such a manner that the positions of feature points (e.g. blood vessels) in the respective compared CT images are made to correspond with each other. This allows the doctor to easily compare even the CT images in which the position variation is included regarding the specified area. The related art is disclosed in Japanese Laid-open Patent Publication No. 2013-141603 SUMMARY According to an aspect of the invention, an image display method includes displaying a
1 of 20 drawing sheets so far from the published document, cropped to the drawing. Every sheet is in the USPTO PDF.
What the patent claimed, word for word. All of it is now free to use.
This application is based upon and claims the benefit of priority of the prior Japanese Patent Application No. 2015-021388, filed on Feb. 5, 2015, the entire contents of which are incorporated herein by reference.
Techniques disclosed in the present embodiments are related to a technique to display images for medical use.
In a medical scene, a doctor often compares computed tomography (CT) images captured at different times for determination of the course of a disease of a patient and so forth. At this time, if the compared region is a lung or the like of the patient, position variation due to heartbeat and breathing is included in the CT images. Thus, for example, image registration is carried out by transforming the image about a specified area in such a manner that the positions of feature points (e.g. blood vessels) in the respective compared CT images are made to correspond with each other. This allows the doctor to easily compare even the CT images in which the position variation is included regarding the specified area. The related art is disclosed in Japanese Laid-open Patent Publication No. 2013-141603 SUMMARY
According to an aspect of the invention, an image display method includes displaying a first image including a living body on a display apparatus, accepting specifying of a first area on the first image, extracting a first feature point group from an area in the first image, the area being located in a distance more than a threshold from the first area, acquiring a second image including the living body, the second image being captured at different timing from the first image, extracting a second feature point group corresponding to the first feature point group, from the second image, generating, by a processor, transformation information based on a positional relationship between the first feature point group and the second feature point group, for carrying out an image registration between the second image and the first image, executing transformation processing by applying the transformation information to the second image, and displaying at least part of a third image generated by the transformation processing on the display apparatus.
The object and advantages of the invention will be realized and attained by means of the elements and combinations particularly pointed out in the claims.
It is to be understood that both the foregoing general description and the following detailed description are exemplary and explanatory and are not restrictive of the invention, as claimed.
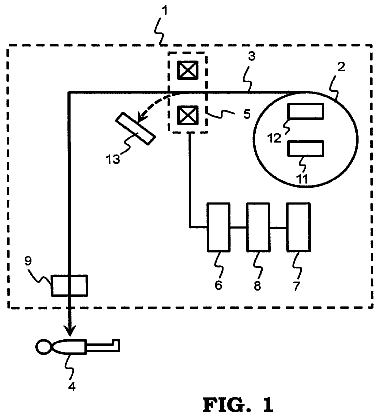
FIG. 1 is a diagram illustrating one example of a CT image photographing system;
FIG. 2 is a diagram illustrating a hardware configuration of an image display apparatus;
FIG. 3 is a diagram illustrating a relationship among contents of processing of a diagnosis assisting unit in an image display apparatus, contents of operation by a physician, and contents of displaying on a juxtaposition display screen;
FIG. 4 is a diagram illustrating a relationship among contents of processing of a diagnosis assisting unit in an image display apparatus, contents of operation by a physician, and contents of displaying on a juxtaposition display screen;
FIG. 5 is a diagram representing one example of information stored in an image database (hereinafter, database will be abbreviated as DB);
FIG. 6 is a diagram illustrating causes of local position variation of a comparison target CT image with respect to a comparison source CT image;
FIGS. 7A, 7B, and 7C are diagrams for explaining position variation based on change in a tumor in more detail;
FIGS. 8A, 8B, 8C, and 8D are diagrams for explaining calculation processing of a representative vector and calculation processing of a corresponding area;
FIG. 9 is a diagram illustrating an image obtained by carrying out local image registration by using a representative vector including influence of non-rigid transformation;
FIG. 10 is a diagram illustrating a functional configuration of a second registration unit;
FIGS. 11A and 11B are first diagrams illustrating contents of processing of a focusing area determining unit;
FIGS. 12A and 12B are diagrams illustrating a calculation method of a representative vector when it is determined that a focusing area exists;
FIGS. 13A and 13B are diagrams illustrating a calculation method of a representative vector when it is determined that a focusing area does not exist;
FIG. 14 is a flowchart of local image registration processing by a second registration unit;
FIG. 15 is a first flowchart of focusing area determination processing;
FIG. 16 is a diagram illustrating an image obtained by carrying out local image registration by using a representative vector from which influence of non-rigid transformation is excluded;
FIGS. 17A, 17B, and 17C are second diagrams illustrating contents of processing of a focusing area determining unit;
FIG. 18 is a second flowchart of focusing area determination processing;
FIGS. 19A and 19B are diagrams illustrating one example of a focusing area; and
FIG. 20 is a third flowchart of focusing area determination processing.
In a patient having a tumor (e.g. adenocarcinoma) in a lung, there is a possibility that alveoli of the lung are collapsed by the tumor and so-called “focusing” in which the positions of neighboring blood vessels and so forth come close to the collapsed place is caused. In the case in which the conventional image registration is carried out about CT images of the lung of such a patient, if a blood vessel near the collapsed place is employed as a feature point, the image is transformed including also the influence of position variation in association with the “focusing.” As a result, in the CT image after the transformation, the position variation in association with the “focusing” is canceled out by the image registration as with the position variation due to heartbeat and breathing.
In one aspect, the techniques disclosed in the present embodiments intend to cancel out position variation due to heartbeat and breathing while leaving the influence of position variation in association with focusing caused by a tumor.
The embodiments will be described below with reference to the accompanying drawings. In the present specification and the drawings, regarding constituent elements including substantially the same functional configuration, overlapping description is omitted by giving the same symbol.
[First Embodiment]
First, a CT image photographing system including an image display apparatus according to a first embodiment will be described. FIG. 1 is a diagram illustrating one example of the CT image photographing system.
A CT image photographing system 100 includes a CT apparatus 110 , an image display apparatus 120 , and an image DB 130 . The CT apparatus 110 and the image display apparatus 120 are electrically coupled and data transmission and reception are carried out between both apparatuses. Furthermore, the image display apparatus 120 and the image DB 130 are also electrically coupled and data transmission and reception are carried out between both apparatuses.
The CT apparatus 110 generates CT images that are slice images of a patient by scanning the inside of the body of the patient by using radiation or the like and executing processing by using a computer (hereinafter, such processing will be referred to as “photographing CT images”). The CT apparatus 110 transmits the captured CT images to the image display apparatus 120 .
The image display apparatus 120 stores the CT images captured in the CT apparatus 110 in the coupled image DB 130 . Furthermore, the image display apparatus 120 functions as a diagnosis assisting unit 140 through execution of an installed diagnosis assisting program by a computer.
The image DB 130 receives the CT images captured in the CT apparatus 110 through the image display apparatus 120 and stores the CT images with a classification in units of plural CT images captured at the same time (imaging group).
The diagnosis assisting unit 140 is a function used when a physician such as a doctor makes a diagnosis of a patient on the basis of the CT images that are captured in the CT apparatus 110 and stored in the image DB 130 . The diagnosis assisting unit 140 displays e.g. CT images captured at different times in juxtaposition so that the physician can make the diagnosis with comparison of the CT images. Hereinafter, one of the CT images displayed in juxtaposition (e.g. CT image captured before the elapse of a given period) will be referred to as the “comparison source CT image” and the other (e.g. CT image captured after the elapse of the given period) will be referred to as the “comparison target CT image.”
The diagnosis assisting unit 140 carries out enlargement displaying of an image of a given area including a position specified by a physician in the comparison source CT image on an enlargement display screen. Furthermore, the diagnosis assisting unit 140 extracts an image of the corresponding area corresponding to the given area including the specified position from the comparison target CT image and carries out enlargement displaying of the extracted image on an enlargement display screen.
In order to execute these kinds of processing, the diagnosis assisting unit 140 includes a first registration unit 141 , a second registration unit 142 , and a display control unit 143 .
The first registration unit 141 is implemented through execution of a first registration program by the computer for example. In displaying CT images captured at different times in juxtaposition, the first registration unit 141 carries out global image registration between the respective CT images by correcting position deviation between the respective CT images by linear transformation.
The second registration unit 142 is implemented through execution of a second registration program by the computer for example. When enlargement displaying of an image of a given area including a position specified by a physician is carried out, the second registration unit 142 extracts an image of the corresponding area from the comparison target CT image by executing transformation processing in the comparison target CT image. This allows the second registration unit 142 to notify the display control unit 143 of the image. Various kinds of processing (e.g. translation) are included in the transformation processing. In the present embodiment, the transformation processing refers to translation.
The display control unit 143 is implemented through execution of a display program by the computer for example. The display control unit 143 displays a comparison source CT image selected by a physician and carries out enlargement displaying of a given area including a position specified by the physician on the enlargement display screen. Furthermore, the display control unit 143 carries out enlargement displaying of an image that is notified by the second registration unit 142 and for which local image registration has been carried out on the enlargement display screen.
Next, a hardware configuration of the image display apparatus will be described. FIG. 2 is a diagram illustrating a hardware configuration of an image display apparatus. As illustrated in FIG. 2 , the image display apparatus 120 includes a central processing unit (CPU) 201 , a read only memory (ROM) 202 , and a random access memory (RAM) 203 . Furthermore, the image display apparatus 120 includes an auxiliary storage device 204 , a coupling device 205 , a display device 206 , an operation device 207 , and a drive device 208 . The respective devices of the image display apparatus 120 are mutually coupled through a bus 209 .
The CPU 201 is a computer that executes various kinds of programs stored in the auxiliary storage device 204 (e.g. the first registration program, second registration program, display program, and so forth).
The ROM 202 is a non-volatile memory. The ROM 202 functions as a main storage device that stores various kinds of programs, data, and so forth for execution of the various kinds of programs stored in the auxiliary storage device 204 by the CPU 201 . For example, the ROM 202 stores boot programs such as basic input/output system (BIOS) and extensible firmware interface (EFI).
The RAM 203 is a volatile memory and includes a dynamic random access memory (DRAM), a static random access memory (SRAM), etc. The RAM 203 is a main storage device that offers a work area expanded when the various kinds of programs stored in the auxiliary storage device 204 are executed by the CPU 201 .
The auxiliary storage device 204 is a computer-readable recording medium in which the various kinds of programs installed in the image display apparatus 120 , data generated through execution of the various kinds of programs, and so forth are recorded.
The coupling device 205 is coupled to the CT apparatus 110 and the image DB 130 and carries out data transmission and reception with the CT apparatus 110 and the image DB 130 . The display device 206 displays CT images that are captured in the CT apparatus 110 and stored in the image DB 130 by a juxtaposition display screen. The operation device 207 accepts various kinds of operation carried out to the image display apparatus 120 by a physician such as a doctor.
The drive device 208 is a device for setting a recording medium 210 . In the recording medium 210 mentioned here, media in which information is recorded optically, electrically, or magnetically, such as compact disc (CD)-ROM, flexible disc, and magneto-optical disc, are included. Furthermore, in the recording medium 210 , semiconductor memories and so forth in which information is electrically recorded, such as ROM and flash memory, are also included.
In the present embodiment, the various kinds of programs stored in the auxiliary storage device 204 are installed through setting of the distributed recording medium 210 in the drive device 208 and reading of the various kinds of programs recorded in the recording medium 210 by the drive device 208 for example. Alternatively, the various kinds of programs are installed by being downloaded from a network through the coupling device 205 .
Next, a description will be made about a relationship among contents of processing of a diagnosis assisting unit 140 of an image display apparatus 120 , contents of operation by a physician at the time, and a juxtaposition display screen displayed on a display device 206 of an image display apparatus 120 .
FIGS. 3 and 4 are diagrams illustrating a relationship among contents of processing of a diagnosis assisting unit in an image display apparatus, contents of operation by a physician, and contents of displaying on a juxtaposition display screen.
When the processing by the diagnosis assisting unit 140 is started in the image display apparatus 120 , as illustrated in FIG. 3 , processing by the display control unit 143 is started and a juxtaposition display screen 300 for displaying CT images captured at different times in juxtaposition is displayed on the display device 206 . In the state in which the juxtaposition display screen 300 is displayed, the physician such as a doctor selects an imaging group of a given region (here, lungs) captured at a given time about a given patient as a comparison source CT image group. This causes the display control unit 143 to read out the selected comparison source CT image group from the image DB 130 . Moreover, when a given comparison source CT image (here, file name=“ImageA 015 ”) is specified from the selected comparison source CT image group by the physician, the display control unit 143 displays the specified comparison source CT image on the juxtaposition display screen 300 .
To carry out comparison with the specified comparison source CT image, the physician selects an imaging group of the same region of the same patient captured at a different time as a comparison target CT image group. For example, the physician inputs a patient identification (ID), photographing date and time, the captured region (here, lungs), and so forth to select the comparison target CT image group. This causes the display control unit 143 to read out an imaging group identified by the input patient name, photographing date and time, captured region, and so forth as the comparison target CT image group from the image DB 130 . Furthermore, the display control unit 143 reads out a comparison target CT image (here, file name=“ImageB 018 ”) corresponding to the comparison source CT image displayed on the juxtaposition display screen 300 from the read comparison target CT image group, and displays the comparison target CT image on the juxtaposition display screen 300 .
At this time, the first registration unit 141 functions in the diagnosis assisting unit 140 and carries out global image registration by carrying out linear correction such as rotation and translation on the read CT image. By the global image registration on the whole of the CT image, global position deviation between the comparison source CT image and the comparison target CT image is resolved.
When the global image registration is completed, as illustrated in FIG. 4 , the physician specifies the position of a tumor part F in the displayed comparison source CT image. This causes the display control unit 143 to carry out enlargement displaying of an image of a given area 401 including the specified position of the tumor part F on an enlargement display screen on the comparison source CT image.
When the enlargement displaying of the image of the given area 401 is carried out, the second registration unit 142 executes transformation processing based on translation in the comparison target CT image and extracts an image of a corresponding area 402 including the position of a tumor part F′ corresponding to the tumor part F (image for which local image registration has been carried out). Furthermore, the second registration unit 142 notifies the display control unit 143 of the image of the corresponding area 402 extracted from the comparison target CT image.
The display control unit 143 carries out enlargement displaying of the image of the corresponding area 402 notified from the second registration unit 142 on an enlargement display screen on the comparison target CT image. This can display the image for which the local image registration has been carried out.
As above, according to the image display apparatus 120 , enlargement displaying of the image of the given area 401 can be carried out when the position of the tumor part F is specified in the comparison source CT image by a physician. Furthermore, the image of the corresponding area 402 can be automatically extracted from the comparison target CT image and be displayed with enlargement on the enlargement display screen. As a result, the physician can easily grasp the corresponding position between the respective CT images included in imaging groups captured at different times and easily make a diagnosis about how the tumor has changed.
Next, an image DB 130 will be described. FIG. 5 is a diagram representing one example of information stored in an image DB. As represented in FIG. 5 , the information stored in the image DB 130 is managed with a classification on each patient basis and FIG. 5 represents one example of information on a patient of a patient ID=“xxx.”
As represented in FIG. 5 , “photographing date and time,” “captured region,” “file name,” and “imaging group” are included in items of the information on the patient. In the “photographing date and time,” information on the date and time when CT images are captured is stored. In the “captured region,” information on the region of the photographing target is stored. In the “file name,” a file name for identifying a file composed of the plural CT images obtained by the photographing is stored. In the “imaging group,” the plural CT images obtained by the photographing are stored.
In the example of FIG. 5 , a file with a file name=“file A” including CT images of ImageA 001 to ImageA 030 obtained by photographing on photographing date and time=“H26. 2. 5 (Feb. 5, 2015)” about the captured region=“lung” is stored in the image DB 130 . Furthermore, a file with a file name=“file B” including CT images of ImageB 001 to ImageB 030 obtained by photographing on photographing date and time=“H26. 8. 3 (Aug. 3, 2015)” about the captured region=“lung” is stored in the image DB 130 .
A dotted line in FIG. 5 indicates that a CT image of “ImageA 015 ” is selected as a comparison source CT image. Furthermore, another dotted line indicates that a CT image of “ImageB 018 ” is selected as a comparison target CT image.
Next, the respective units of the diagnosis assisting unit 140 will be described. In the following, the second registration unit 142 will be mainly described.
As described above, at the timing of the completion of global image registration, overall position variation has been corrected between the comparison source CT image and the comparison target CT image, whereas local position variation is left. For this reason, for enlargement displaying of the image of the corresponding area 402 corresponding to the given area 401 including the position of the tumor part F specified by a physician, first the second registration unit 142 obtains the local position variation of the comparison target CT image with respect to the comparison source CT image. Then, the second registration unit 142 obtains the corresponding area 402 by executing transformation processing based on translation in the comparison target CT image according to the obtained variation. This can extract an image for which the local image registration has been carried out.
Here, in the case of the captured region=“lung,” as major cause of the occurrence of the local position variation, two causes are cited. The two causes include a cause based on breathing and heartbeat and another cause based on change (change over time) in a tumor. FIG. 6 is a diagram illustrating causes of local position variation of a comparison target CT image with respect to a comparison source CT image.
When local position variation occurs as illustrated in FIG. 6 , for example an image 610 is displayed in the area on the comparison target CT image including the same coordinates as the given area 401 in the comparison source CT image.
When an image 600 of the given area 401 in the comparison source CT image and the image 610 of the area on the comparison target CT image including the same coordinates as the given area 401 are compared in FIG. 6 , it turns out that the positions of blood vessels and the position of the tumor greatly deviate due to the local position variation. In FIG. 6 , thick lines indicate blood vessels 601 to 603 and 611 to 613 and hatched areas indicate the tumor parts F and F′.
The position variation based on breathing and heartbeat refers to position variation in association with the motion of the diaphragm at the time of breathing for example. The position of the diaphragm varies between the case in which the patient exhales and the case in which the patient inhales. Thus, in association with this variation, the positions of the respective parts of the lung vary. That is, local position variation based on breathing and heartbeat is possibly caused between the comparison source CT image and the comparison target CT image except for the case in which the states of the breathing of the patient at the time of photographing are completely identical.
The position variation based on breathing and heartbeat is translation of the whole of the given area 401 in a given direction for example. Therefore, this position variation can be regarded as rigid transformation.
On the other hand, the position variation based on change in a tumor refers to position variation caused due to the growth of a malignant tumor like an adenocarcinoma or the like with destruction of alveoli of a lung and a decrease in the volume of the alveoli of the lung by the volume of air kept by the alveoli of the lung (that is, in association with focusing caused by the tumor). A detailed description will be made by using FIGS. 7A, 7B, and 7C . FIGS. 7A to 7C are diagrams for explaining position variation based on change in a tumor in detail.
FIG. 7A illustrates the state of surrounding tissue immediately after generation of a malignant tumor such as an adenocarcinoma at a position indicated at a tumor central point O. As illustrated in FIG. 7A , the distance from the tumor central point O to a point D 1 on a bronchus 711 and the distance from the tumor central point O to a point C 1 on a blood vessel 712 are each r 1 in the state immediately after the generation of the malignant tumor.
FIG. 7B illustrates a state in which the surrounding tissue including the bronchus 711 and the blood vessel 712 has moved toward the tumor central point O due to the growth of the malignant tumor with destruction of alveoli of a lung around the tumor. As illustrated in FIG. 7B , due to the movement of the surrounding tissue toward the tumor central point O, the distance from the tumor central point O to a point D 2 on the bronchus 711 and the distance from the tumor central point O to a point C 2 on the blood vessel 712 each become r 2 (<r 1 ).
FIG. 7C illustrates a state in which the surrounding tissue including the bronchus 711 and the blood vessel 712 has further moved toward the tumor central point O due to the growth of the malignant tumor with further destruction of alveoli of the lung around the tumor. As illustrated in FIG. 7C , due to the movement of the surrounding tissue toward the tumor central point O, the distance from the tumor central point O to a point D 3 on the bronchus 711 and the distance from the tumor central point O to a point C 3 on the blood vessel 712 each become r 3 (<r 2 ).
As above, the position variation based on change in a tumor (in association with focusing caused by the tumor) has a characteristic that surrounding tissue moves toward the tumor central point O, and can be regarded as non-rigid transformation because how the position varies differs depending on the position in the given area.
As illustrated in FIGS. 7A to 7C , the tissue around the tumor can be roughly classified into tissue of a tumor area 703 , tissue of a focusing area 702 , and tissue of a normal area 701 . In the tumor area 703 , because being broken by the malignant tumor, part of tissue existing in FIG. 7A does not exist in FIG. 7C . On the other hand, in the focusing area 702 , tissue existing in FIG. 7A exists also in FIG. 7C . However, the position of the corresponding tissue varies in the central direction (B 1 .fwdarw.B 2 .fwdarw.B 3 ). Furthermore, in the normal area 701 , tissue existing in FIG. 7A exists also in FIG. 7C and the position of the corresponding tissue (A 1 .fwdarw.A 2 .fwdarw.A 3 ) also hardly varies.
As is apparent from the above description of FIGS. 6 and 7 , the local position variation between the comparison source CT image and the comparison target CT image includes “variation based on breathing and heartbeat,” which can be regarded as rigid transformation, and “variation based on change in a tumor,” which is non-rigid transformation. Furthermore, in the case of the “variation based on change in a tumor,” the tissue around the tumor can be roughly classified into the normal area 701 , the focusing area 702 , and the tumor area 703 according to the degree of movement toward the tumor central point O.
Next, a description will be made by using FIGS. 8A, 8B, 8C, 8D, and 9 about a problem when the second registration unit 142 carries out local image registration regarding an area in which rigid transformation and non-rigid transformation exist in a mixed manner like that illustrated in FIG. 6 in a comparison target CT image.
As described above, for carrying out the local image registration in the comparison target CT image, the second registration unit 142 executes transformation processing based on translation. That is, the second registration unit 142 executes not non-linear transformation processing but linear transformation processing. This is because among physicians are those who do not desire an image to be processed by the non-linear transformation processing in radiologic interpretation.
Here, for executing the transformation processing based on translation, the second registration unit 142 calculates a representative vector indicating which position in the comparison target CT image the given area 401 has moved to.
FIGS. 8A, 8B, 8C, and 8D are diagrams for explaining calculation processing of a representative vector and calculation processing of a corresponding area. FIG. 8A is a diagram illustrating correspondence vectors (black arrows) that are the differences between the positions of feature points included in the given area 401 ( FIG. 4 ) of a comparison source CT image and the positions of feature points in the comparison target CT image corresponding to these feature points. An area 800 is an area in which the feature points in the comparison target CT image corresponding to the feature points included in the given area 401 of the comparison source CT image are included, and is an area used for the calculation of the representative vector. Hereinafter, this area in the comparison target CT image will be referred to as the representative vector calculation target area 800 .
Here, suppose that the second registration unit 142 calculates a representative vector 810 by using all correspondence vectors included in the representative vector calculation target area 800 . In this case, an image for which local image registration has been carried out can be extracted by processing illustrated in FIG. 8B .
FIG. 8B is a diagram illustrating how the image for which local image registration has been carried out is extracted from the comparison target CT image by using the inverse vector of the representative vector 810 and executing transformation processing in which translation is carried out in such a direction as to cancel out this representative vector 810 . As illustrated in FIG. 8B , the second registration unit 142 obtains an area 802 by translating an area 801 in the comparison target CT image including the same coordinates as the given area 401 in the comparison source CT image on the basis of the representative vector 810 . Then, the second registration unit 142 extracts the image for which local image registration has been carried out by extracting the image of the area 802 from the comparison target CT image.
However, the image extracted in this manner is none other than an image achieved by obtaining a representative vector on the basis of the assumption that only rigid transformation is caused in an area in which rigid transformation and non-rigid transformation exist in a mixed manner and translating the area to cancel out the assumed rigid transformation. That is, the area is translated to cancel out also the influence of the non-rigid transformation.
A more detailed description will be made by using FIGS. 8C and 8D . FIG. 8C is a diagram illustrating the correspondence vectors corresponding to the position variation based on breathing and heartbeat (rigid transformation) in the correspondence vectors linking the positions of the feature points included in the given area 401 of the comparison source CT image and the positions of the feature points in the comparison target CT image corresponding to these feature points. As illustrated in FIG. 8C , the correspondence vectors based on the rigid transformation are all oriented in the same direction and all have the substantially same length. The correspondence vectors based on the rigid transformation exist in the normal area 701 and the focusing area 702 . However, in the tumor area 703 , the feature points of the comparison target CT image corresponding to the feature points of the comparison source CT image do not exist and therefore the correspondence vectors also do not exist.
On the other hand, FIG. 8D is a diagram illustrating the correspondence vectors corresponding to the position variation based on change in a tumor (non-rigid transformation) in the correspondence vectors linking the positions of the feature points included in the given area 401 of the comparison source CT image and the positions of the feature points in the comparison target CT image corresponding to these feature points. As illustrated in FIG. 8D , the correspondence vectors based on the non-rigid transformation exist only in the focusing area 702 (excluding the tumor area 703 ) and are oriented in the direction toward the center of the tumor.
As above, the correspondence vectors based on the rigid transformation and the correspondence vectors based on the non-rigid transformation have difference in the vector length and orientation and have difference also in the existence position.
Meanwhile, the correspondence vectors illustrated in FIG. 8A result from addition of the correspondence vectors illustrated in FIG. 8C and the correspondence vectors illustrated in FIG. 8D to each other.
That is, in the correspondence vectors existing at the positions corresponding to the focusing area 702 in the correspondence vectors illustrated in FIG. 8A , the correspondence vectors based on the rigid transformation and the correspondence vectors based on the non-rigid transformation exist in a mixed manner. For this reason, when the representative vector 810 is calculated by using the correspondence vectors existing at the positions corresponding to the focusing area 702 , the influence of the non-rigid transformation is included in the representative vector 810 . Furthermore, when local image registration is carried out by using such a representative vector 810 , it is impossible to carry out image registration with high accuracy.
A description will be made by using a concrete image. FIG. 9 is a diagram illustrating an image obtained by carrying out local image registration by using a representative vector including influence of non-rigid transformation. In the example of FIG. 9 , an image 900 obtained by carrying out the local image registration (image of the area 802 of a comparison target CT image) and the image 600 of the given area 401 in a comparison source CT image are illustrated in an overlapping manner.
As illustrated in FIG. 9 , the positions of blood vessels 901 to 903 and the tumor part F′ included in the image 900 deviate from the positions of the blood vessels 601 to 603 and the tumor part F included in the image 600 even though the local image registration has been carried out.
In view of the above problem in the calculation of the representative vector in an area in which rigid transformation and non-rigid transformation exist in a mixed manner, the second registration unit 142 of the present embodiment obtains the representative vector with exclusion of the influence of the non-rigid transformation. The second registration unit 142 of the present embodiment will be described below by using FIGS. 10 to 16 .
FIG. 10 is a diagram illustrating a functional configuration of a second registration unit. As illustrated in FIG. 10 , the second registration unit 142 includes an area identifying unit 1001 , a correspondence vector calculating unit 1002 , a focusing area determining unit 1003 , a representative vector calculating unit 1004 , and a image registration unit 1005 .
The area identifying unit 1001 identifies the given area 401 including a position specified by a physician. For example, the area identifying unit 1001 acquires coordinates on a comparison source CT image to identify the position of the given area 401 .
The correspondence vector calculating unit 1002 extracts feature points from the given area 401 of the comparison source CT image identified by the area identifying unit 1001 . Furthermore, the correspondence vector calculating unit 1002 searches for the respective feature points in a comparison target CT image corresponding to the respective extracted feature points. Moreover, the correspondence vector calculating unit 1002 calculates correspondence vectors on the basis of the differences between the positions of the respective feature points extracted from the comparison source CT image and the positions of the respective feature points in the comparison target CT image corresponding to these respective feature points.
The focusing area determining unit 1003 determines whether or not the focusing area 702 is included in the representative vector calculation target area 800 on the basis of the correspondence vectors calculated in the correspondence vector calculating unit 1002 . Furthermore, if determining that the focusing area 702 is included, the focusing area determining unit 1003 calculates the boundary position between the normal area 701 and the focusing area 702 . Moreover, the focusing area determining unit 1003 notifies the representative vector calculating unit 1004 of the determination result about whether or not the focusing area 702 is included and the calculation result of the boundary position between the normal area 701 and the focusing area 702 .
The representative vector calculating unit 1004 calculates a representative vector in the representative vector calculation target area 800 on the basis of the correspondence vectors calculated in the correspondence vector calculating unit 1002 . If it is determined that the focusing area 702 is not included in the representative vector calculation target area 800 , the representative vector calculating unit 1004 calculates the representative vector by using all correspondence vectors in the representative vector calculation target area 800 (excluding the tumor area). On the other hand, if it is determined that the focusing area 702 is included in the representative vector calculation target area 800 , the representative vector calculating unit 1004 calculates the representative vector by using the correspondence vectors excluding the correspondence vectors included in the focusing area 702 and the tumor area 703 in the correspondence vectors in the representative vector calculation target area 800 .
The representative vector calculating unit 1004 executes average processing for calculating the representative vector by using the correspondence vectors.
The image registration unit 1005 extracts an image of the corresponding area 402 corresponding to the given area 401 from the comparison target CT image on the basis of the representative vector calculated in the representative vector calculating unit 1004 . For example, the image registration unit 1005 moves the coordinates to identify the position of the given area 401 by using the representative vector on the comparison target CT image to thereby calculate coordinates after the movement. Moreover, the image registration unit 1005 extracts the image of the area identified by the calculated coordinates after the movement (corresponding area 402 ) from the comparison target CT image and notifies the display control unit 143 of the image. This allows the display control unit 143 to carry out enlargement displaying of the image for which local image registration has been carried out on an enlargement display screen.
Next, a description will be made about a concrete example of functions of the focusing area determining unit 1003 and the representative vector calculating unit 1004 among the respective units included in the second registration unit 142 .
First, a concrete example of functions of a focusing area determining unit 1003 will be described. FIGS. 11A and 11B are first diagrams illustrating contents of processing of a focusing area determining unit and illustrating two concrete examples of FIGS. 11A and 11B .
The description continues in the full USPTO document.
About 6,579 words. The USPTO PDF has it with every drawing.
Fees are due 3.5, 7.5 and 11.5 years after grant. This patent expired on December 19, 2025, so the fee marked "not paid" was the one that went unpaid.
IMAGE DISPLAY APPARATUS AND IMAGE DISPLAY METHOD
Filed Jan 2016 · published Aug 2016Image display apparatus and image display method
Filed Jan 2016 · granted Dec 2017Earlier publications, parents and continuations. None of them can still be enforced, or this patent would not be listed.
Prior art cited by the examiner or applicant. Useful when you check your own idea for novelty.
Everything on this page comes from the documents linked above.