Related applications
This application is the U.S. National Phase under 35 U.S.C. §371 of International Application No. PCT/JP2013/053175, filed on Feb. 12, 2013, which in turn claims the benefit of Japanese Application No. 2012-029058, filed on Feb. 14, 2012 and Japanese Application No. 2012-274191, filed on Dec. 17, 2012, the disclosures of which are incorporated by reference herein.
Technical field
The present invention relates to an apparatus or the like to evaluate a pattern shape of a semiconductor pattern. The present invention further relates to an apparatus or the like to evaluate a pattern shape of a semiconductor pattern, and particularly relates to a pattern shape evaluation apparatus that is suitable to find an appropriate manufacturing condition of semiconductor or to extract a parameter to find an appropriate manufacturing condition for semiconductor.
Background art
Conventionally a pattern shape of a semiconductor device is controlled in its manufacturing process using the dimensions such as a width of a line pattern or a diameter of a hole measured with a length-measuring SEM as means to evaluate a pattern formed as to whether it is formed as designed. Along with the miniaturization of semiconductor devices, it becomes common to form a pattern of the exposure wavelength or less, and to this end, ultra-high resolution techniques such as off-axis illumination and optical proximity correction are introduced. However, a change in pattern shape due to process fluctuations includes a tilt of a pattern side wall, rounding of a corner of a pattern or a constriction of a pattern, and deformation of a pattern due to a change in aberration of an exposure device, which are difficult to measure with the measurement of the pattern. Then, a technique to evaluate a tilt of a pattern side wall is known by creating outlines of an upper part and a lower part of a pattern side wall, and evaluating the tilt of the pattern side wall based on the two-dimensional shape of the pattern and the width of a white-band (see Patent Document 1).
This method enables the evaluation based on the two-dimensional shape of the pattern and the degree of tilt in the height direction of the pattern.
Projection exposure is a method to transfer a semiconductor pattern on a wafer, where light for exposure is applied to a photomask as a shielding member with a pattern to be printed drawn thereon, whereby an image of the photomask is projected on resist on the water through a lens system. During the exposure, the focus and the dose are determined as conditions of the exposure, and if the resist has unevenness at the surface due to nonuniformity of the resist application, the focus and the dose will be shifted, and so the dimensions and the shape of the pattern transferred may change, which is different from the normal pattern. The focus may be deviated due to other factors such as non-flatness resulting from a photomask and aberration of a lens.
Theses deviations in the focus and the dose resulting from the resist application, the photomask and the aberration of a lens have repeatability, and so a method of finding a correction value for the focusing and the dose with a semiconductor measurement device and feed-backing the correction value to an exposure device (see Patent Document 2) is known. This method can correct the deviation of focus and dose resulting from the resist application, the photomask and the aberration of a lens, whereby variations in dimensions of a pattern can be suppressed.
Aberrations of a lens include coma and astigmatism. Astigmatism causes a phenomenon where light is collected at different positions between in the horizontal direction and in the vertical direction. For instance, when a hole pattern is created by transferring a circle pattern having the same dimension for the horizontal and the vertical directions, astigmatism, if any, will cause an oval pattern having different dimensions between the horizontal and the vertical directions. To correct this, a method of finding a focus value using a line pattern (see Patent Document 2) is used, in which a focus value in the horizontal direction is found using a vertical line pattern and a focus value in the vertical direction is found using a horizontal line pattern, and correction is performed based on these focus values, whereby the optimum exposure conditions for the horizontal direction and the vertical direction can be obtained.
A focus value varies with unevenness of a wafer, and so it is better to know focus values for the horizontal and the vertical directions at one position. To this end, a method of using a dedicated pattern such as a cross pattern or a wedge-shaped pattern to obtain a vertical line pattern and a horizontal line pattern at one time also is available (see Patent Document 3). CITATION LIST Patent Literatures
Patent Literature 1:
Jp 2004-228394 a
Patent Literature 2: JP 2005-64023 A (corresponding to U.S. Pat. No. 6,929,892)
Patent Literature 3: JP 2008-140911 A (corresponding to U.S. Pat. No. 8,023,759) SUMMARY OF INVENTION Technical Problem
It is impossible in some cases to judge whether the focus should be negative or positive from the white-band width. As patterns become finer, process fluctuations have to be managed so that a fluctuation in a few nanometers could be detected for focus, for example. To find such a minute process fluctuation, rounding at an upper part and a skirt shape at a lower part of a pattern side wall has to be detected precisely. A change in shape of such rounding at an upper part and skirt shape at a lower part, resulting from process fluctuations, depend on various factors such as the pattern shape, the space in the pattern, the material and the thickness of a photoreceptor, and so a local change of the shape cannot be found from the tilt of the side wall that is found from the white-band width.
The following proposes an image evaluation apparatus having a first object to find such a local change precisely.
When a dedicated pattern such as a horizontal or vertical line pattern, a cross pattern or a wedge-shaped pattern is fabricated in a wafer and an image of such a dedicated pattern is shot, preparation is required therefor and so it takes time to perform such a job. Further, when a pattern is evaluated at a specific part or in a specific direction using a CD-SEM or the like, if noise is present partially on a SEM image, for example, an erroneous evaluation result may be obtained. Further, the absolute amount of a signal to output a measurement value may not be enough for a certain size of the cross pattern or the like, this may cause the failure in exposure condition evaluation based on a sufficiently precise measurement.
The following proposes a pattern shape evaluation apparatus having a second object to evaluate the exposure condition in X direction and/or in Y direction based on a plurality of measurement results including measurement results in a plurality of directions other than X direction and Y direction, and to output a parameter enabling evaluation of the exposure condition, the exposure condition or an adjustment condition of the exposure condition. Solution to Problem
The following proposes, as one embodiment to fulfill the first object, an image evaluation apparatus configured to find an exposure condition of a semiconductor pattern from an image shot with an electron beam, including: a storage unit that stores a model indicating a relationship between a feature amount that is obtained by creating a plurality of outlines from a SEM image and an exposure condition, and outline creation parameter information corresponding to the model; an outline creation unit that creates a plurality of outlines from a SEM image using the outline creation parameter information; and an estimation unit that uses a feature amount that is found from the plurality of outlines created by the outline creation unit and the model to find an exposure condition.
In the proposed image evaluation apparatus, the outline creation unit creates three or more outlines. In the proposed image evaluation apparatus, the outline creation parameter information is information to let the outline creation unit create an outline, and includes the number of outlines and information to create each of the outlines corresponding to the number.
The following proposes, as one embodiment to create a model indicating a relationship between a feature amount that is obtained by creating a plurality of outlines from the SEM image and an exposure condition, an image evaluation apparatus configured to create a model using an exposure condition of a plurality of semiconductor patterns and a plurality of SEM images corresponding thereto, including: an outline creation unit that creates a plurality of outlines from a SEM images using outline creation parameter information; a model creation unit that creates a model equation from a feature amount obtained from the plurality of outlines created by the outline creation unit and an exposure condition corresponding to a SEM image; and an evaluation unit that uses a plurality of pieces of the outline creation parameter information to find corresponding models via the outline creation unit and the model creation unit, and finds a model with good evaluation from the plurality of models found and outline creation parameter information corresponding to the model.
As one embodiment to fulfill the second object, proposed is a pattern shape evaluation apparatus including an image processing apparatus configured to evaluate a target pattern included in an image formed by an image acquisition apparatus, the image processing apparatus being configured to find feature amounts of the target pattern in a plurality of directions, apply weight assigned for the plurality of directions to the feature amounts in the plurality of directions, and find a parameter required to adjust an exposure condition in a specific direction based on the weight. Advantageous Effects of Invention
The above configuration enables finding of a change in curved shape of a pattern side wall as in rounding at an upper part and a skirt part at a lower part of the side wall or of a local change in shape at the side wall, and so enables detection of minute process fluctuations.
The above configuration enables finding of a parameter required for an exposure condition in X direction and/or Y direction (specific directions) based on feature amounts in a plurality of directions other than X direction and Y direction. This enables correct adjustment of an exposure condition using an actual pattern that may have insufficient edge amount in X direction and Y direction as in a dedicated pattern. Since feature amounts in X direction and Y direction can be extracted using an edge in a direction other than X direction and Y direction, precise evaluation can be performed based on sufficient information amount.
Brief description of drawings
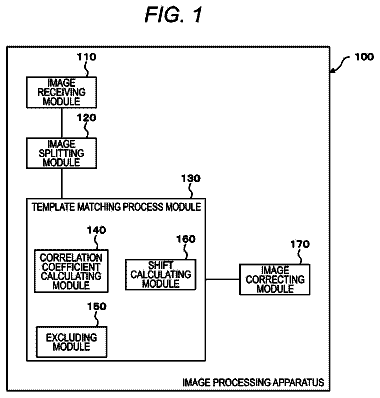
FIG. 1 shows an embodiment of an image evaluation apparatus.
FIG. 2 shows an embodiment of an outline creation unit.
FIG. 3 shows an embodiment of a model creation unit.
FIG. 4 shows an embodiment of an evaluation unit.
FIG. 5 shows an embodiment of an estimation unit.
FIG. 6 shows the processing flow of an image evaluation method.
FIG. 7 shows the processing flow by a model creation unit.
FIG. 8 shows the processing flow at the stage of outline creation.
FIG. 9 shows the processing flow at the stage of model creation.
FIG. 10 shows the processing flow at the stage of dose estimation creation.
FIG. 11 shows the processing flow at the stage of estimation.
FIG. 12 shows one example of an outline creation parameter.
FIG. 13 shows a change of a pattern side wall with focusing.
FIG. 14 shows the relationship between a threshold of an outline and a pattern side wall.
FIG. 15 shows an embodiment of a GUI of display means.
FIG. 16 shows a space in a pattern and the size of a hole diameter.
FIG. 17 shows a change of a pattern side wall at the end point part.
FIG. 18 describes an example to make a division into parts.
FIG. 19 describes one example of a semiconductor measurement system.
FIG. 20 schematically describes a scanning electron microscope.
FIG. 21 shows an embodiment of an image evaluation apparatus.
FIG. 22 shows an embodiment of a feature amount extraction unit.
FIG. 23 shows an embodiment of an outline extraction unit.
FIG. 24 shows an embodiment of a direction-specific exposure condition estimation unit.
FIG. 25 shows an embodiment of a direction-specific feature separation unit.
FIG. 26 shows a pattern for each direction that is used by a direction detection unit.
FIG. 27 shows the direction of an outline and the feature amount.
FIG. 28 shows one embodiment of a horizontal-direction estimation unit and a vertical-direction estimation unit.
FIG. 29 shows one embodiment of a direction-specific exposure condition model creation unit.
FIG. 30 shows one embodiment of a horizontal-direction model creation unit and a vertical-direction model creation unit.
FIG. 31 shows one embodiment of a direction-specific separation unit.
FIG. 32 shows an embodiment of an image evaluation apparatus.
FIG. 33 shows one example to designate a region by a direction-specific region designation unit.
FIG. 34 shows an embodiment of a feature amount extraction unit.
FIG. 35 shows one embodiment of a direction-specific exposure condition estimation unit.
FIG. 36 shows one embodiment of a direction-specific exposure condition model creation unit.
FIG. 37 shows one embodiment of a feature amount extraction unit.
FIG. 38 shows one embodiment of a direction-specific feature separation unit.
FIG. 39 shows the direction of an outline and the feature amount.
FIG. 40 shows one embodiment of a GUI as input/output.
FIG. 41 shows one example to designate a region for each direction.
Description of embodiments
The following describes an exemplary image evaluation apparatus as an embodiment, relating to a method for evaluating a pattern image to monitor process fluctuations using pattern image data shot by a SEM, and such an apparatus. The following describes a specific example thereof to detect process fluctuations using a two-dimensional shape of a plurality of outlines of the pattern based on image data.
The following describes an example to find a model to detect process fluctuations using a two-dimensional shape of a plurality of outlines of the pattern based on image data and creation parameters of the outlines as well.
Referring to the drawings, the following describes an apparatus equipped with the function to detect process fluctuations using a two-dimensional shape of outlines of the pattern based on image data and a measurement detection system. Specifically the following describes an apparatus including a Critical Dimension-Scanning Electron Microscope (CD-SEM) as one type of a measurement apparatus and such a system.
The following description exemplifies a charged particle radiation apparatus as an apparatus to form an image, and describes an example using a SEM as one embodiment. This is not a limiting example, and for instance, a focused ion beam (FIB) apparatus configured to form an image with an image beam scanned over a sample may be used as a charged particle radiation apparatus. Note that, however, since a very high magnification is required to measure a finer pattern precisely, a SEM is desirably used because a SEM is in general superior in the resolution to a FIB apparatus.
FIG. 19 schematically describes a measurement and examination system including a plurality of measurement or examination apparatuses connected to a network. This system includes a CD-SEM 2401 to measure dimensions of a pattern mainly on a semiconductor wafer, a photomask or the like, and a defect examination device 2402 configured to irradiate a sample with an electron beam, thus obtaining an image thereof and extracting a defect based on a comparison between the image and a reference image that is registered beforehand, which are connected to a network. To the network, a condition setting device 2403 to set a measurement position, a measurement condition and the like on design data of a semiconductor device, a simulator 2404 to simulate the appearance of a pattern based on the design data of the semiconductor device, manufacturing conditions of a semiconductor manufacturing apparatus and the like, and a storage medium 2405 to store design data of the semiconductor device in which layout data and manufacturing conditions of the semiconductor device are registered.
The design data is represented in the GDS format or the OASIS format, for example, which is stored in a predetermined form. The design data may be of any type as long as software to display the design data can display its format form, and can deal with it as graphic data. The storage medium 2405 may be built in a controller of the measurement device or the examination device, the condition setting device 2403 or the simulator 2404 . The CD-SEM 2401 and the defect examination device 2402 each may have a controller, by which necessary control for the devices is performed, and these controllers may be equipped with the function of the simulator and the setting function of the measurement conditions and the like.
The SEM is configured to focus an electron beam emitted from an electron source with a plurality of stages of lenses and to let a scan deflector scan a sample with the focused electron beam one-dimensionally or two-dimensionally.
Secondary electrons (SE) or backscattered electrons (BSE) emitted from the sample during the scanning with an electron beam are detected by a detector, which are stored in a storage medium such as a frame memory while being in synchronization with the scanning by the scan deflector. Image signals stored in this frame memory are added up by an arithmetic device installed in the controller. Scanning by the scan deflector can be performed for any size, position and direction.
Such control, for example, is performed by the controller of each SEM, and images and signals that are obtained as a result of the scanning with an electron beam are sent to the condition setting device 2403 via a communication line network. The present example describes the controller to control each SEM and the condition setting device 2403 as separate members, which is not a limiting example, and the condition setting device 2403 may be configured to perform the control of the apparatus and the measurement processing collectively, or each controller may perform the control of each SEM and the measurement processing together.
The condition setting device 2403 or the controller stores a program to execute the measurement processing, and performs measurement or calculation in accordance with the program.
The condition setting device 2403 has a function to create a program (recipe) to control the operation of each SEM on the basis of the design data of semiconductor, and so functions as a recipe setting unit. Specifically, this device sets positions or the like to perform processing necessary to the SEM, such as a desired measurement point, automatic focusing, automatic astigmatism correction, addressing point and the like on the design data, the outline data of the pattern or the design data subjected to simulation, and creates a program to automatically control the sample stage, the deflector and the like of the SEM based on the setting. To create a template below described, the device further includes a processor to extract information on a region as the template from the design data and create the template based on the extracted information, or includes or stores a program therein to allow a general processor to create the template.
FIG. 20 schematically describes the structure of the scanning electron microscope. An electron beam 2503 that is drawn from an electron source 2501 by an extracting electrode 2502 and is accelerated by a not illustrated accelerating electrode is narrowed by a condenser lens 2504 as one form of a focus lens, and then is scanned by a scan deflector 2505 over a sample 2509 one-dimensionally or two-dimensionally. The electron beam 2503 is decelerated by negative voltage applied to an electrode built in a sample mount 2508 while being focused by the action of an objective lens 2506 to be applied on the sample 2509 .
When the electron beam 2503 is applied to the sample 2509 , electrons 2510 such as secondary electrons and backscattered electrons are emitted from the irradiated position. The emitted electrons 2510 are accelerated toward the electron source by the action of acceleration due to the negative voltage applied to the sample, and collide with a conversion electrode 2512 , thus generating secondary electrons 2511 . The secondary electrons 2511 emitted from the conversion electrode 2512 are captured by a detector 2513 , and the output I of the detector 2513 varies with the amount of captured secondary electrons. The brightness of a display not illustrated then varies with this output I. For instance, in order to form a two-dimensional image, a deflection signal to the scan deflector 2505 and the output I of the detector 2513 are synchronized, thus forming the image of the scanned region. The scanning electron microscope illustrated in FIG. 20 includes a deflector (not illustrated) that moves the scanned region with the electron beam.
The example of FIG. 20 describes the case of converting electrons emitted from the sample by the conversion electrode once for detection, which is of course not a limiting structure. For instance, it may be configured to dispose the detection face of an electron multiplier tube or the detector on the trajectory of accelerated electrons. A controller 2514 has a function to control various parts of the scanning electron microscope while having a function to form an image based on the detected electrons and a function to measure the width of a pattern formed on the sample based on the intensity distribution of the detected electrons called a line profile.
Next the following describes one embodiment of an image evaluation apparatus 1 for image recognition. The image evaluation apparatus 1 may be built in the controller 2514 , image processing may be executed by an arithmetic device built therein, or image evaluation may be executed by an external arithmetic device (e.g., the condition setting device 2403 ) via a network. Embodiment 1
FIG. 1A describes an exemplary model creation unit 1 of the image evaluation apparatus that creates a model to find the relationship between a SEM image and the exposure condition and outputs an outline creation parameter used therefor.
An image of a focus exposure matrix (FEM) wafer with a pattern printed thereon while changing the exposure conditions (focus, dose) for each shot (the unit of one exposure) is shot with a SEM beforehand. Since the position on the wafer indicates a correspondence with a shot under a certain exposure condition, such information is called exposure condition information 30 . In FIG. 1A , such a plurality of different pieces of exposure condition (focus, dose) information 30 and SEM images 31 obtained by the shooting are used. A SEM image, if it has a deformed pattern and so is not suitable for model creation, has to be removed beforehand.
An outline creation unit 11 creates a plurality of outlines from the SEM image 31 on the basis of an outline creation parameter 32 . The outline creation parameter 32 refers to information on the number of outlines to be created by the outline creation unit 11 and on a parameter to create each outline.
A model creation unit 12 uses the data on a plurality of outlines that is created by the outline creation unit 11 to find a feature amount, and associates is with information on the exposure condition (focus, dose), thus creating a model indicating the relationship between the feature amount and the exposure condition. An evaluation unit 13 uses the model created by the model creation unit 12 to evaluate the model.
For the creation of a model, it is important to find a parameter to create a plurality of outlines that is suitable to understand a change in the pattern side wall due to the exposure condition. This is because the shape of a pattern changes variously at rounding of an upper part and a skirt part of a lower part due to process fluctuations, depending on the pattern shape, the space of the pattern, the material and the thickness of a photoreceptor, and so the size of the change varies with the height of a viewing point of the side wall (height position). FIG. 13 illustrates an exemplary change of a pattern side wall with focus. In the example of FIG. 13A , when the focus changes as F 1 , F 2 and F 3 , the point of the upper part PA shifts to right due to shrinkage of the photoreceptor at the upper part, whereas the point of the lower part PB of the photoreceptor does not change very much.
In the example of FIG. 13B , when the focus changes as F 1 , F 2 and F 3 , the point of the upper part PA changes less, whereas the point of the lower part PB of the photoreceptor shifts to left due to shrinkage of the photoreceptor at the lower part.
In the example of FIG. 13C , when the focus changes as F 1 , F 2 and F 3 , the point of the upper part PA and the point of the lower part PB of the photoreceptor change less, whereas the point PC between the upper part PA and the lower part PB of the photoreceptor shifts to right due to shrinkage of the photoreceptor
FIG. 14 illustrates the relationship between a threshold of an outline and a pattern side wall. This shows a hole pattern, where (a) is a cross-section of the pattern side wall part along i-line of the SEM image of (b). As shown in (b), the SEM image shows the shape of the pattern as a white band. A white band appears because, when a pattern is shot with a SEM, the amount of secondary electrons reflected against the pattern side wall increases and the brightness becomes high at that part, and so a part like a white band appears along the pattern shape. In this white band, a portion having the largest tilt of the cross section of the pattern side wall corresponds to the peak position Pp of the brightness of the white band in the profile (c). The upper part PA and the lower part PB of the pattern correspond to foot parts Pa and Pb, respectively, on both ends of the mountain of the profile indicating the brightness of the white band. Whether either one of the both sides of the white band corresponds to the upper part or the lower part of the pattern can be found using information on whether the inside or the outside of the pattern is a concave or a convex, for example.
Let that both sides of the white band are the inside and the outside, the circle on the inside of the white band corresponds to a concave and a lower part because it is a hole pattern. On the other hand, the circle on the outside of the white band corresponds to the upper part. In this way, the upper part and the lower part of the pattern or the position therebetween, for example, can be understood based on the profile of the brightness. When an outline is created from this profile, let that the peak of the white band is 100%, the position at 50% on the inside (right of the peak position) of the white band is set at a point of the outline to be created. Based on the profile of the brightness, similar positions at 50% on the inside (right of the peak side) of the white band at points along the pattern shape are connected to create a line, which is called an outline created on the inside at 50%. For instance, four points of 30%, 70% and 90% in addition to 50% may be used, and four outlines may be created similarly.
In that case, parameters to create the outlines may be “inside, th(threshold) 30, th(threshold)50, th(threshold)70 and th(threshold)90”. Let that the peak is 100% and when an outline is similarly created at the position of 50% on the outside (left of the peak position) of the white band, a parameter may be set as “outside, threshold 50”. A parameter of the outline creation parameter 32 to create each of the outlines corresponding to the number of outlines to be created is information on these thresholds.
In this way, an outline is created at any threshold corresponding to the height position of the pattern side wall using the profile of the white band including information on the height position of the pattern side wall.
When the pattern side wall hardly changes, process fluctuations cannot be detected. Conversely, when a height position changing greatly can be found, process fluctuations can be detected precisely. Further, when the height position found is only one, whether it may be at a position of the pattern side wall greatly changing or not, a change from the best position for the focus becomes uniform symmetrically, and so a determination as to whether the sign for focus estimation is to be positive or negative cannot be made. In the case of two height positions, a change in a rounded shape cannot be detected, and so a precise determination is difficult. Then, three or more height positions are considered, and their respective height positions are found so that a great change in a rounded shape can be detected. This enables the detection of a part where a rounded shape changes greatly at rounding of the upper part and a skirt part of the lower part, and so enables a precise determination of a sign for focus estimation and estimation of the exposure condition.
The following describes a difference between the case where a change is found using two points based on two outlines and the case where a change is found using three points based on three outlines.
For instance, let that two points based on two outlines are point A and point B, only one change between A and B can be detected based on the two points. On the other hand, when three points of A, B and C based on three outlines are used, three changes between A and B, B and C and A and C, i.e., a change at a plurality of parts can be detected. For information, in the case of four points of A, B, C and D based on four outlines, six changes between A and B, B and C, C and D, A and C, A and D, and B and D can be detected.
When the height position of the resist, which changes with focus, changes, it is difficult to find the value of focus precisely only from one variation that is obtained from two points based on two outlines.
When a local change occurs at two parts or a plurality of parts instead of at one part, since only one variation can be detected from two points, a change at one of the parts only has to be detected, or a plurality of changes has to be considered as one collectively for detection. For instance, let that a part close to point A changes on the positive side of the focus, and a part close to point B changes greatly on the negative side, only one of the part close to point A and the part close to part B has to be found, or a change including both of the part close to point A and the part close to point B has to be found when the change is found using two points based on two outlines. In the case of including both of the parts, it is not clear which one of the part close to point A and the part close to point B changes. The direction of the change may be reversed. On the other hand, three points based on three outlines enables detection as to which one of the part close to point A and the part close to point B changes, and estimation on the negative side can be performed using three variations, from which improved precision can be expected. Further, four points based on four outlines enables detection of six changes, and so a change at more height positions of the resist can be detected. Although, in the case of one variation, its absolute value only is used, three variations enable the usage of not only their absolute values but also variations of relative values and difference values.
In this way, three or more outlines used enables finding of variations at a plurality of resist height positions, thus improving the estimation precision of the focus value. Note here that too many outlines used means longer processing time, which is not practicable, and so ten or less outlines are sufficient. More outlines means that adjustment of a threshold is not required, and a fixed threshold can be used. When less outlines are used due to the restriction of processing time, it is effective that the resist height position that changes with focus is found. For instance, outlines are created with thresholds of a lot of different resist height positions, and such outlines are used to examine thresholds between points having large variations due to focus, and the actual evaluation can be performed using the outlines at selected thresholds.
When a pattern side wall is viewed at a plurality of height positions, it is difficult to determine what a height position is good for the detection of a large change in shape while associating it with how to take the feature amount and a model. Therefore, a model obtained as a result is evaluated by the evaluation unit 13 for determination. That is, the outline creation parameter 32 having good evaluation as the model can be a parameter to create an outline showing an effective feature for the model to find the exposure condition, and a parameter to create an outline that can represent a variation in shape of the pattern side wall well.
Then, a plurality of models are created by the above processing using a plurality of outline creation parameters 32 , and the evaluation unit 13 evaluates the models about how to fit and outputs a model 34 having the highest evaluation value and such an outline creation parameter 35 .
This allows the creation of an outline creation parameter and a model that can deal with various changes at the pattern side wall due to factors such as the pattern shape, the space in the pattern, the material and the thickness of a photoreceptor.
FIG. 12A shows one example of a plurality of outline creation parameters. As illustrated in FIG. 12A , the outline creation parameter 32 is information on the number of outlines and on height positions (thresholds) corresponding to the outlines in number, to which information whether it is an upper part or a lower part of the pattern side wall, such as information on the inside or the outside of the white band of the pattern or a concave or a convex of the pattern, may be added. One outline creation parameter may be indicated in each line and the list of a plurality of lines may be created, which is then processed one by one from the above. Alternatively, the number of outlines may not be indicated explicitly as in FIG. 12B , because the number of outlines can be determined based on the information on the number of height positions (thresholds), and this may be information of a plurality of height positions (thresholds) at which outlines are to be created.
FIG. 2 illustrates an embodiment of the outline creation unit. The outline creation unit 11 creates a plurality of pieces of outline data 11 a for a SEM image 31 based on the outline creation parameter 32 .
When the number of outlines that the outline creation parameter 32 creates is n, for example, parameters to create these outlines are read in n pieces of outline creation units 1101 to 11 n , respectively. Then, the outline creation units 1101 to 11 n create the n pieces of outlines based on the SEM image. The created outline data may be stored in an outline storage unit 1100 . Although n pieces of the outline creation units are used in this case, one outline creation unit may be used to create an outline n times.
FIG. 3 shows an embodiment of the model creation unit. The model creation unit finds a feature amount from the outline data created by the outline creation unit 11 , and creates a model indicating the relationship between the Focus value, the Dose value information and the feature amount.
A feature amount calculation unit 121 aligns the outline data and a base pattern, and finds a distance between each pixel of the outline and a corresponding pixel position of the base pattern. Alignment of the outline data and the base pattern is performed by forming images of the outline data and the base pattern, both of which are expanded, and are matching-treated based on normalized correlation for alignment. Alternatively, images of them are formed, then their weighted centers are found, and alignment may be performed so that their weighted centers are overlapped. They are not limiting examples, and alignment of the outline data and the base pattern may be performed by known matching techniques. The base pattern may be design data, simulation data, or image data or outline data that is created from one or a plurality of SEM images. One of a plurality of pieces of outline data created by the outline creation unit 11 may be the base pattern. Following the alignment, pixels of the outline and the base pattern are associated while setting a pixel of the base pattern that is the closest to the pixel of the outline as a corresponding pixel of the base pattern, and finding the distance between these corresponding pixels. The distance for all pixels of the outline from their corresponding pixels of the base pattern is found, and the static amount of the distance found for all pixels, e.g., the average value or the dispersion value, is set as a feature amount. Instead of all pixels, it may be found from a plurality of pixels. The feature amount may include a plurality of types. This feature amount is found for each outline. The correspondence between the pixels is found with reference to pixels of the outline, which may be found with reference to pixels of the base pattern. It is known that line edge roughness changes with its exposure conditions, and line edge roughness has periodicity. Then, a spatial frequency such as by Fourier transform (FFT) may be found and a feature amount indicating the periodicity of the line edge roughness may be used, whereby a focus value may be found.
Based on the feature amount for each outline that is found by the feature amount calculation unit 121 and the exposure condition (focus value, dose value) information 30 , a model-creation unit 122 creates a model. The model may be created by finding a regression equation or may be found by linear programming. For instance, the exposure condition Y may be represented in the regression equation by the linear sum of the feature amounts A 1 , A 2 . . . An with their respective weight coefficients X 1 , X 2 , . . . Xn, Y=X 1 A 1+ X 2 A 2+ . . . XnAn+b.
In this case, the model will be values of the weight coefficients X 1 , X 2 , . . . Xn of the feature amounts and b. Although not illustrated, the model-creation unit 122 may include a storage unit such as a memory to store information on the exposure condition and a feature amount obtained from outlines of a SEM image.
FIG. 4 shows an embodiment of the evaluation unit.
The evaluation unit 13 evaluates a plurality of models found by the model creation unit 1 , and selects the best model and such an outline creation parameter among them based on their evaluation values.
The description continues in the full USPTO document.
 Lapsed, fee not paid11 drawings