Field of the invention
The present invention concerns a data analysis system. More in particular the invention relates to a computer implemented method and a system for ranking items of data included in records in a database.
Background to the invention
These days much data is generated and stored in digital form. Since the 1980s the world's capacity to digitally store information has increased by over twenty percent per year. In 2012 every day 2.5 exabytes (2.5×10.sup.18) of data were created. Some parts of this data is publicly available, other parts are in company data.
The term ‘big data’ is often used in this connection for a collection of data so large and complex that it becomes difficult to process using on hand database management tools or traditional data processing applications.
Much of this data is stored in large databases, sometimes referred to as data warehouses. Such databases can store millions or even billions of records. Each record can be associated with thousands of items of data.
There is a general need to be able to query databases to uncover records that correspond to a predetermined content, e.g. to determine which records contain certain items of data. However, with the explosive growth of the number of data records it becomes increasingly difficult to determine queries that properly yield records that provide the desired information. It will be clear that a query yielding a large number of records still leaves the user in doubt as to which record are more or less relevant.
Therefore, there is a specific need to efficiently and intuitively query databases. It is also of great importance to be able to perform queries in real time, i.e. with minimal delay. Delay times are often seen as a severe hindrance in querying, and may dissuade people from continued querying of a database. In other words, people simply give up and stop querying if delay times are perceived as annoying. In present times of relatively fast computing, delay times of as little as a few tenths of a second can already be perceived as prohibitively annoying.
Summary of the invention
In accordance with a first aspect of the present invention there is provided a computer implemented method of accessing a data set comprising a plurality of records, wherein each record is associated with one or more items of data. The method comprises using the computer to receive a data query on the data set and assigning each record to an in-group or to an out-group with respect to the query. Thus the data set can be divided into an in-group and an out-group. The computer determines words appearing in records of the in-group and generates a user interface representative of said words. The computer also determines words appearing in records of the out-group and generates a user interface representative of said words. Words can be nouns, verbs, adjectives, etc. as encountered in text documents. Words can also be identifiers, names, metadata, dates, flags, tags, derived data, numerical values or bandings etc. More in general, words are anything which can be represented as text, including items of data extracted from the records which are actual words, text labels assigned to or calculated from data included in the records—e.g. high-income or 30,000 or some_kind_of.sub.— data_label.
According to an aspect, the computer is used to determine a first plurality of words having a high discriminative power favoring records of the in-group and to determine a second plurality of words having a high discriminative power favoring in records of the out-group. The computer can generate a user interface representative of said first and second plurality of words. A high discriminative power for records of the in-group indicates word having a high likelihood of occurring in a record of the in-group and a low likelihood of occurring in a record of the out-group. The higher the difference in the likelihoods, the higher the discriminative power. The difference can be related to an absolute difference of numbers of occurrences of the word in the in-group and in the out-group. This takes into account that words that hardly occur in the out-group and only a few times in the in-group may have a high relative likelihood of occurring in the in-group, but are less efficient for positively identifying records as being comprised in the in-group. Similarly, a high discriminative power for records of the out-group indicates word having a high likelihood of occurring in a record of the out-group and a low likelihood of occurring in a record of the in-group. The higher the (absolute) difference in the likelihoods, the higher the discriminative power. Providing a selection of words in the in-group provides the advantage that the user is enabled to select a different query item, related to the previous query item. The user needs no personal knowledge to identify such related query item, as the system extracts the potential query items from the records. Also, the need to type a new query item may be obviated as the user only needs to select a further query item. Providing a selection of words in the out-group provides the advantage that the user is immediately made aware of what else is contained in the records beside his initial query. The user can instantly see what is background or opposite to his previous query. This greatly enhances efficiency of a query session. This also increases the chances of finding hard to uncover details in the records that otherwise would easily be missed.
In accordance with a further aspect, the user interface includes a first view comprising data representative of the first and second group, and the user interface includes at least one further view comprising data representative of data representative of the records in different formats. The further views can e.g. provide geographical information relating to the records, temporal information relating to the records, or relational information relating to the records. This provides increased understanding of the nature and content of the records.
In accordance with a further aspect, the views are coupled, so as to allow user selection of an item of data as input for a query in any view. The data query on the data set can include selection of one or more data items in the first view or one of the at least one further views. The remaining views are updated to reflect the selected item of data. As such, the invention fuses analytics and search.
In accordance with a further aspect, upon user selection of an item of data for a query, all views are updated upon user selection of one or more items of data in one of the views. All views can be instantaneously updated to reflect the selected item of data. This provides smooth user experience and enhances a flow of querying.
In accordance to a further aspect, a computer implemented method of accessing a data set comprising a plurality of records, wherein each record is associated with one or more items of data is provided. The method comprises using the computer to receive a data query on the data set. Each record is assigned to a first group or to a second group. Items of data appearing in records of the first group are determined and a user interface representative of said items of data is generated. Items of data appearing in records of the second group are determined and a user interface representative of said items of data is generated.
In accordance with a further aspect, the items of data relate to text, e.g. words or groups of words, images, image fragments moving images, audio fragments, numbers, chemical formula fragments, chemical formulae, mathematical formula fragments, and/or mathematical formulae.
According to a further aspect a computer implemented method of generating a user interface comprising data representative of a reference item of data included in a record in a data set comprising a plurality of records is provided. The method comprises using the computer to determine items of data appearing in records including the reference item and generating a user interface representative of said items of data. The method further includes determining items of data appearing in records not including the reference item and generating a user interface representative of said items of data.
In accordance with a further aspect, the items of data relate to text, e.g. words, images, moving images, and/or audio. E.g. for images an image cloud could be represented or alternatively the word cloud could be a list of tags of metadata for the images (or moving images). Similarly, for audio a cloud or list of tags or metadata for the audio could be presented.
According to a further aspect, a data processing system for ranking items of data is provided.
According to a further aspect, a computer readable medium storing computer implementable instructions which when implemented by a programmable computer cause the computer to perform the method according to the invention is provided.
Brief description of the drawings
The file of this patent contains at least one drawing executed in color. Copies of this patent with color drawing(s) will be provided by the Patent and Trademark Office upon request and payment of the necessary fee. Embodiments of the present invention will now be described in detail with reference to the accompanying drawings in which:
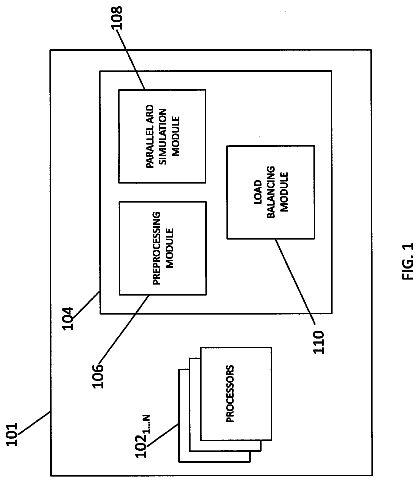
FIG. 1 is a schematic block diagram of a system in accordance with an embodiment of the present invention;
FIG. 2 is a schematic representation of a user interface in accordance with an embodiment of the invention;
FIG. 3 is a schematic representation of a user interface in accordance with an embodiment of the invention;
FIG. 4 is a schematic representation of a user interface in accordance with an embodiment of the invention;
FIG. 5 is a schematic representation of a user interface in accordance with an embodiment of the invention;
FIG. 6 is a schematic representation of a user interface in accordance with an embodiment of the invention;
FIG. 7 is a schematic representation of a user interface in accordance with an embodiment of the invention;
FIG. 8 is a schematic representation of a user interface in accordance with an embodiment of the invention; and
FIG. 9 is a schematic representation of a user interface in accordance with an embodiment of the invention;
FIG. 10 is a schematic flow chart of a method in accordance with an embodiment of the invention;
FIG. 11 is a schematic flow chart of a method in accordance with an embodiment of the invention;
FIG. 12 is a schematic block diagram of a data processing system in accordance with an embodiment of the invention; and
FIGS. 13A-13E are schematic representations of a simplified example of determining a score.
Detailed description
FIG. 1 shows a schematic block diagram of a system 1 in accordance with an embodiment of the present invention. The system 1 includes a database 2 . The database 2 includes a plurality of records 4 . The records can for instance include texts, images, video fragments, audio fragments etc. Each record 4 is associated with one or more items of data. The items of data can e.g. be text items, such as words or phrases, included in the record 4 . Words can also be identifiers, names, metadata, dates, flags, tags, derived data, numerical values or bandings, timestamps etc. The items of data can also be images, such as moving images, or fragments thereof. The items of data can also be geographical data, temporal data, connectivity data, etc.
The system 1 further includes a data processing system 6 in communication with the database 2 . The system 1 further includes a display 8 in communication with the data processing system 6 . The data processing system 6 is arranged for generating data representing a user interface. The user interface is displayed on the display 8 . In FIG. 1 the user interface includes a first view 10 including a dual word cloud containing items of data of records 4 of the database 2 . The dual word cloud includes a first plurality of words relating to an in-group of records that comply with a particular query. The dual word cloud also includes a second plurality of words relating to an out-group of records that do not comply with said query. In this particular example the records relate to email messages and the word cloud includes items of data in the form of words appearing in the emails as described in U.S. patent application Ser. No. 13/102,648 published as US2012/284155 incorporated herein by reference. The senders and recipients of the email messages in the database are represented by positions around the edge of the circle and the existence of an email message is shown by the presence of a line connecting the points associated with a sender and the recipient(s). In FIG. 1 the user interface includes a second view 12 including a circular representation of items of data of records 4 of the database 2 . In this particular example the circular representation includes items of data in the form of sender-recipient relationships in the emails. The system 1 further includes an input unit, such as a keyboard, mouse and/or touch unit 14 in communication with the data processing system 6 .
As will be described below, the user interface, especially the dual word cloud, allows for highly efficient browsing through the records of the database 2 . Also, the user interface provides a transparent and intuitive way of browsing. Further, as will be described below, the user interface assists in refining a query of the database. Thereto, the data processing system can propose items of data that have high discriminative power favoring in-group records that comply with the present query. As will be highlighted below, the data processing system can also propose items of data that have high discriminative power favoring out-group records that do not comply with the present query. Items of data having a high discriminative power favoring in-group records are items of data that have a high likelihood of occurring in an in group record and a low likelihood of occurring in an out group record. Items of data having a high discriminative power favoring out-group records are items of data that have a high likelihood of occurring in an out group record and a low likelihood of occurring in an in group record.
In FIG. 1 the word cloud includes both words having high discriminative power for in-group records and words having high discriminative power for out-group records. It has been found that the user interface including items of data having high discriminative power for in-group records and items of data having high discriminative power for out-group records increases the efficiency of browsing through the database. It, inter alia, provides insight into what has been selected by the present query versus what other information is contained in the database. It can also help identify what information (e.g. which items of data) relate to background information rather than to foreground information that has been selected by the user. Knowledge of background information also aids in quickly focusing a query towards a desired result.
FIG. 2 shows a schematic example of a user interface in an initial state. This example relates to a database 2 including a large number of records 4 in the form of email messages. The email messages contain items of data in the form of text. The items of data include text, such as words, encountered in the body text of the email messages. The items of data also include text in the form of sender names, recipient names, addresses, dates, times, flags (“private”, “confidential”, “request read receipt”, etc.). The items of data can also include text, such as words, included in attachments to the email messages, etc. The text relating to the email message can also be metadata, for instance that that the email message had been marked as junk email, the message has not been read, the message has been recalled, or the like. In the exemplary initial state the forty words occurring most frequently in the records are displayed in view A in the form of a word cloud 40 .
In a second view B the user interface displays data representative of the records in a different format. In FIG. 2 view B presents data representative of all records in the database. View B presents data representing the combination of sender and recipient(s) of each email in the database represented as a line in the circular graph. The circumference of the circular graph in view B represents items of data relating to email users (senders and receivers) of the email messages in the database. Interactions between the email users are represented as lines connecting a sender with one or more receivers of the associated email message, as described in WO2012/152726 and US2014/0132623, both incorporated herein by reference.
In the initial state shown in FIG. 2 a user query 200 may be performed on the database. Thereto a user selects an item of data by means of an input unit 28 . The input unit may be a keyboard, mouse, touchpad, touch functionality of a touch screen, microphone, camera or the like. The item of data may be selected 204 from the first view A or may be selected 202 from the second view B. FIG. 2 shows an example of performing a query by selecting 202 an item of data from view B. In the example the selection concerns the emails sent to or from a particular person, indicated in black at 44 .
In response to receipt of the user selection, the data processing system 6 processes 206 the user selection. Thereto, the data processing system determines the item of data or items of data associated with the user selection. In this example, the data processing system 6 determines the word, here the name, associated with the sender of the selected stream of email messages. This selection of items of data forms the user query to be performed on the records 4 in the database 2 .
For performing the user query, the data processing system 6 assigns 302 each record 4 to a first group of records or to a second group of records. Here the first group constitutes an in-group, i.e. a group of records that complies with the user query. Here the in-group contains the records that comprise the selected items(s) of data, i.e. the name of the sender. It will be appreciated that it is not necessary that all records indicate the selected item of data as the sender of that particular email message. Also records containing the selected item of data as recipient, or as part of the content of the email message, will form part of the in-group. Here the second group constitutes an out-group, i.e. a group of records that does not comply with the user query. Here the out-group contains the records that do not comprise the selected items(s) of data. Hence, in this example the records of the database are divided into an in-group and an out-group.
Next, the data processing system 6 determines a first plurality of items of data, here words, appearing in records of the in-group, a second plurality of items of data, here words, appearing in records of the out-group. In this example, the first plurality of words consists of the words that have the highest discriminative power for records of the in-group. In this example, the second plurality of words consists of the words that have the highest discriminative power for records of the out-group. The data processing system 6 generating a user interface representative of the first plurality of items of data and the second plurality of items of data. In the user interface, the items of data of the first plurality are distinguishable from the items of data of the second plurality. The distinguishability may e.g. be given by presenting the first and second pluralities in different colors, fonts, underlined or not, etc.
Upon the user selection in view of the query both views A and be can be updated. In FIG. 3 the first view A shows the first plurality 48 of items of data, here the top twenty words (underlined), and the second plurality 50 of items of data, here the bottom twenty words (not underlined). The first and second plurality are visualized as a word cloud 40 . It will be appreciated that the selected item of data (selected at 44 in view B of FIG. 3 ) is also among the first plurality of items of data as indicated at 46 , viz. the word (name) “dasovich”. It will be appreciated that the word cloud 40 can be constructed to provide an indication of the discriminative power. In this example a font size of the items of data (words) in the word clouds is scaled according to the discriminative power (for the in-group or the out-group) associated with the respective item of data. It is also possible the word cloud 40 can be constructed to provide an indication of an average distance between two items of data of one group within the texts of the records of that group. In this example a distance in between two items of data (words) in the word clouds is scaled according to an average distance between said two items of data within the corresponding records.
FIG. 3 showed a user selection in the second view B resulting in a word cloud 40 containing items of data from the in-group as well as items of data from the out-group.
It is also possible to select an item of data in the first view A. FIG. 4 shows an example of a user interface when in the first view A of FIG. 3 the item of data “california” is selected at 52 . Similarly as described above, the data processing system 6 assigns 302 each record 4 to a first group of records or to a second group of records. Here the first group constitutes the in-group, i.e. the group of records including the word “california”. Here the second group constitutes the out-group, i.e. the group of records not including the word “california”. With the records re-assigned to the first and second groups, the discriminative power for each item of data can be determined. FIG. 4 shows in the first view A a word cloud including the redetermined first and second pluralities of items of data. Simultaneously, the second view B is updated. The selected item of data “california” is used to determine all email messages including the word “california”. The graphical representation of these email messages is shown in black at 56 in the second view B of FIG. 4 in accordance with US2014/0132623, incorporated herein by reference.
FIG. 5 shows an example of a user interface when in the first view A of FIG. 3 the item of data “senate” is selected at 54 . Similar as explained in relation to FIG. 4 the first view A is updated due to the selection of the item of data “senate”. Similarly, the second view B is updated in accordance with US2014/0132623. The update indicates the records including “senate” in black at 58 . The example of FIG. 5 includes a third view C. In this third view C the user interface displays data representative of the records in yet a different format. In FIG. 5 view C presents data representative of a distribution of email messages as a function of time. In horizontal direction the sender-recipient interactions of the records are shown. Horizontal lines represent connections from a sender to a recipient for the records in the database. The senders and recipients are indicated at the top of the graph. In the vertical direction it is indicated at which moment in time the email message was sent. View C is updated in view of the selected item of data “senate” as described in US2014/0059456, incorporated herein by reference. The update indicates the records including “senate” in black at 60 .
It will be appreciated that in the example of FIGS. 2-5 the multiple views, and the possibility to select items of data for querying the database provides highly useful possibilities for interactively querying the database. It is for example possible to select a word, such as “california” as shown above and instantaneously see the email paths (sender-recipient) that have an occurrence of said word, and simultaneously and instantaneously see the temporal changes in the occurrence of the word in the records. From this the user can continue by selecting the email paths just indicated as relevant in view of “california” occurring in the records, and see in the first view words related to these email paths. This may initiate a query based on another word than “california”. Alternatively, the user could continue by selecting a time slot indicated as relevant in view of “california” occurring in the records, and see in the first view words related to this time slot. This may initiate a query based on yet another word than “california”. Also, the first view provides insight in other words that have a high discriminative power for records including the word “california”, which can be selected for further querying. Further, the first view provides insight in other words that have a high discriminative power for records not including the word “california”. These too may be used as user selection for further querying. As such, the invention fuses analytics and search. It has been found that in queries that are aimed at uncovering hard-to-find information the out-group information can be particularly useful in arriving at query items that lead to the desired results. Moreover, as will be appreciated from the above, the entire querying can be performed without typing a single word. This is very useful in preventing writer's block from keeping a user from querying the database.
FIGS. 6-9 relate to a further example. FIG. 6 shows a schematic example of a user interface in an initial state. This example relates to a database 2 including a large number of records 4 in the form of police reports. The police reports contain items of data in the form of text. The items of data include text, such as words, encountered in the body text of the police reports. The items of data also include text in the form of police officer identification, names, addresses, dates, times, etc. In this example the twenty most frequently occurring words are displayed in view A in the form of a list 62 of words. In this example the list 62 is an ordered list. The most frequently occurring item of data is here positioned at the top of the list, the next most frequently occurring item of data at the next position, and so on.
In a second view B the user interface displays data 64 representative of the records in a different format. In FIG. 6 view B presents data 64 representative of a distribution of police reports as a function of time. It will be appreciated that the records thereto include items of data relating to time. In vertical direction a numerical index of the records is shown. In this example the numerical index is representative of a police route corresponding to the report. In the horizontal direction it is indicated at which moment in time the police report was filed.
In a third view C the user interface displays data 66 representative of the records in yet a different format. In FIG. 6 view C presents data 66 representative of all records in the database. In this example the records include data representative of a geographical location. View C presents data representing for each record in the database the geographical location associated with that record represented as a dot on a representation of a map as described in U.S. patent application Ser. No. 14/215,238, incorporated herein by reference.
In the initial state shown in FIG. 6 a user query 200 may be performed on the database. Thereto a user selects an item of data by means of an input unit 28 . The item of data may be selected 204 from the first view A, the second view B or the third view C. FIG. 7 shows an example of performing a query by selecting an item of data from view C. In the example the selection concerns a geographical area indicated at 68 . The geographical area is selected by selecting an area in the representation of the map. The area can e.g. be selected by drawing a contour, such as a rectangle, e.g. by using the mouse.
In response to receipt of the user selection, the data processing system 6 processes 206 the user selection. Thereto, the data processing system determines the items of data associated with the user selection. In this example, the data processing system 6 determines the geographical indicators associated with the police reports having a geographical indicator that falls within the selected area. This selection of items of data forms the user query to be performed on the records 4 in the database 2 .
For performing the user query, the data processing system 6 assigns 302 each record 4 of the database 2 to a first group of records or to a second group of records. Here the first group constitutes an in-group, i.e. the records that comprise the selected items(s) of data, i.e. the geographical indicator corresponding to the selected area. Here the second group constitutes an out-group, i.e. the records that do not comprise the selected items(s) of data, i.e. the geographical indicator corresponding to the selected area. Hence, in this example the records of the database are divided into an in-group and an out-group.
FIG. 7 shows in the first view A a first list 70 of items of data representative of the first plurality of items of data. FIG. 7 shows in the first view A a second list 72 of items of data representative of the second plurality of items of data. The first and second lists are ordered lists in this example.
Simultaneously, the second view B is updated. The selected items of data determine all records associated with the police reports having a geographical indicator that falls within the selected area. The graphical representation of these police reports as black dots at 74 in the second view B of FIG. 7 . In this example the numerical indexes of the records associated with the selected geographical area are mainly in the range of 1100 - 1150 and 1500 - 1550 . These numerical indexes correspond to police routes within the selected geographical area.
It is also possible to select an item of data in the first view A. FIG. 8 shows an example of a user interface when in the first view A of FIG. 6 or FIG. 7 the item of data “heroin” is selected at 76 from the first list 70 . Similarly as described above, the data processing system 6 assigns 302 each record 4 to a first group of records or to a second group of records. Here the first group constitutes the in-group, i.e. the group of records including the word “heroin”. Here the second group constitutes the out-group, i.e. the group of records not including the word “heroin”. With the records re-assigned to the first and second groups, the discriminative power for each item of data can be determined. FIG. 8 shows in the first view A the first list 70 of words according to the redetermined first plurality of items of data. FIG. 8 shows in the first view A the second list 72 of words according to the redetermined second plurality of items of data. In this example the first list 70 contains fewer items of data than the second list.
Simultaneously, the second view B is updated. The selected item of data “heroin” is used to determine all records including the word “heroin”. The records associated with the police reports including the word “heroin” are indicated as black dots at 78 in the second view B of FIG. 8 . It will be appreciated that in this example the records including the item of data “heroin” are spread out over many numerical indexes and spread out in time. However, it is for instance possible to see temporal effects in the occurrence of the word “heroin” in the records. At 79 for example a temporal increase of the occurrence of the word “heroin” in the records can be observed.
Simultaneously, the third view C is updated. The selected item of data “heroin” is used to determine all records including the word “heroin”. The records associated with the police reports including the word “heroin” are indicated as white dots at 80 in the third view C of FIG. 8 . It will be appreciated that in this example the records including the item of data “heroin” are spread out over a large geographical range.
It is also possible to select an item of data in the second view B. FIG. 9 shows an example of a user interface when in the second view B of FIG. 6 , FIG. 7 , or FIG. 8 a range 82 of numerical indexes in the range of 100 - 150 in a certain time period is selected. In response to receipt of the user selection, the data processing system 6 processes 206 the user selection. Thereto, the data processing system determines the items of data associated with the user selection. In this example, the data processing system 6 determines the numerical indexes and time stamps associated with the police reports within the selection. This selection of items of data forms the user query to be performed on the records 4 in the database 2 .
For performing the user query, the data processing system 6 assigns 302 each record 4 of the database 2 to a first group of records or to a second group of records. Here the first group constitutes an in-group, i.e. the records that comprise a numerical index and time stamp associated with the police reports within the selection. Here the second group constitutes an out-group, i.e. the records that do not comprise the selected items(s) of data, i.e. do not comprise both a numerical index and time stamp associated with the police reports within the selection.
FIG. 9 shows in the first view A a first list 70 of items of data representative of the first plurality of items of data. FIG. 9 shows in the first view A a second list 72 of items of data representative of the second plurality of items of data. The first and second lists are ordered lists in this example.
Simultaneously, the third view C is updated. The selected items of data, i.e. the numerical indexes and time stamps within the selection are used to determine all records including a numerical index and time stamp within the selection. These records are indicated as white dots at 84 in the third view C of FIG. 9 . It will be appreciated that in this example the records including a numerical index and time stamp within the selection are concentrated in downtown Chicago.
It will be appreciated that in the example of FIGS. 6-9 the multiple views, and the possibility to select items of data for querying the database provides highly useful possibilities for interactively querying the database. It is for example possible to select a word, such as “heroin” as shown above and immediately see the geographical areas that have an occurrence of said word, and simultaneously see the temporal changes in the occurrence of the word in the records. From this the user can continue by selecting the geographical area just indicated as relevant in view of “heroin” occurring in the records, and see in the first view words related to this geographical area. This may initiate a query based on another word than “heroin”. Alternatively, the user could continue by selecting a time slot indicated as relevant in view of “heroin” occurring in the records, and see in the first view words related to this time slot. This may initiate a query based on yet another word than “heroin”. Also, the first view provides insight in other words that have a high discriminative power for records including the word “heroin”, which can be selected for further querying. Further, the first view provides insight in other words that have a high discriminative power for records not including the word “heroin”. These too may be used as user selection for further querying.
FIG. 10 shows a schematic flow chart of a method in accordance with an embodiment of the invention. In step 100 the records of the database are preprocessed, so as to yield the concordance and/or the list of representations. The results of preprocessing are presented to the user, e.g. in the first view A and the second view B as described above. Next, a user query is performed in step 200 . In response to the user query a processing step 300 is performed, yielding the first plurality of items of data and the second plurality of items of data. In step 400 the views are updated in accordance with the processing and the (re)determined first and second plurality of items of data.
An embodiment of a possible implementation of the invention will now be explained in more detail in relation to FIG. 11 and FIG. 12 . FIG. 12 shows an example of a schematic representation of a data processing system 6 according to the invention. The data processing system 6 is associated with a database 2 storing a set of records. The processing system 6 includes a retrieval unit 20 arranged for retrieving records from the database 2 . As will be explained below, the data processing system 6 further includes an identification unit 22 arranged for identifying in each record one or more items of data. A generation unit 24 is arranged for generating a concordance of the items of data identified in the records. The data processing system further includes an assignation unit 26 arranged for assigning each record to a first group of records or to a second group of records. A conversion unit 30 may be included for generating a list of representations, each representation representing a record in the database 2 . The data processing system further includes a processing unit 34 arranged for determining for each item of data a first indicator representative of its occurrences in the records of the first group, determining for each item of data a second indicator representative of its occurrences in the records of the second group; and determining for each item of data a score representative of a discriminative power of that item of data on the basis of the first and second indicator of that item of data. The data processing system 6 includes, or is associated with, a memory 28 for storing the concordance and/or the list of representations. The data processing unit further includes an input unit 32 for receiving a user input and an output unit 36 for outputting information towards the user.
In this embodiment, the method starts by preprocessing 100 the records 4 contained in the database 2 . Thereto, a retrieval unit 20 of the data processing system 6 retrieves 102 all records from the database. In the example mentioned in relation to FIG. 10 , the retrieval unit 20 retrieves all email messages from the database 2 . FIG. 13A shows a simplified example for four records, each containing a text of a few words. An identification unit 22 identifies 104 items of data included within the records 4 . In the example of FIG. 5A the identification unit 22 identifies all unique words within the text data of the records. In this example, the identification unit 22 further assigns 108 an identifier to each unique identified item of data. A generation unit 24 then generates a concordance of all unique items of data. The concordance for the simplified example of FIG. 13A is shown in FIG. 13B . The concordance can include the identifiers. In this example, the preprocessing 100 also includes generating 114 , by a generation unit 24 , a list of representations. Each representation represents a record of the database and includes the unique items of data, and/or the corresponding identifiers, occurring in that record. FIG. 13C shows the representations of the records of the simplified example of FIG. 13A . In an embodiment, the representation may also include data representative of a prevalence of each occurring item of data within the record.
It will be appreciated that in practice the concordance can be modified for optimizing the concordance for the purpose of browsing the records 4 . The concordance may be optimized such that the included items of data represent relevant query items.
The description continues in the full USPTO document.
 Lapsed, fee not paid10 drawings