Background of the invention
Field of the Invention
The present invention relates to an image processing apparatus and an image processing method used for ophthalmological consultations.
Description of the Related Art
Ophthalmic examinations are widely performed for the purpose of early diagnosis of lifestyle-related diseases and diseases that rank highly among causes of loss of eyesight. A scanning laser ophthalmoscope (SLO), which is an image processing apparatus that uses the principle of a confocal laser microscope, is an apparatus that performs Raster scanning of an eye fundus using a laser as a measuring beam and obtains a planar image at a high resolution and a high speed based on the intensity of the return light. The apparatus that captures this planar image will be referred to as an SLO apparatus, and the planar image will be referred to as an SLO image below.
In recent years, it has been possible to obtain a retinal SLO image with an improved horizontal resolution by increasing the diameter of the measuring beam in the SLO apparatus. However, there has been a problem in acquiring a retinal SLO image in that increasing the diameter of the measuring beam is accompanied by a decrease in the S/N ratio and the resolution of the SLO image due to aberrations in the eye of the examination subject.
In order to resolve the above-mentioned problem, an adaptive optics SLO apparatus has been developed that has an adaptive optics system that measures aberrations in the eye of the examination subject in real-time using a wavefront sensor and corrects aberrations of a measuring beam or its return light that occur in the examination subject eye using a wavefront compensation device, thereby enabling the acquisition of an SLO image with a high horizontal resolution.
This SLO image having a high horizontal resolution can be obtained as a moving image, and in order to observe blood flow dynamics for example in a non-invasive manner, retinal blood vessels are extracted from the frames of the moving image, and the movement speed and the like of blood cells in capillaries are subsequently measured. Also, in order to evaluate the relationship between the photoreceptor cells and the visual function using the SLO image, photoreceptor cells P are detected, and subsequently the density distribution and the alignment of the photoreceptor cells P are measured. FIG. 6B shows an example of an SLO image with a high horizontal resolution. The photoreceptor cells P, a low luminance region Q that corresponds to the position of a capillary, and a high-luminance region W that corresponds to the position of a leukocyte can be observed.
In the case of observing the photoreceptor cells P, measuring the distribution of photoreceptor cells P, or the like using the SLO image, the focus position is set near the outer layer of the retina (B 5 in FIG. 6A ) and an SLO image such as FIG. 6B is captured. On the other hand, there are retinal blood vessels and bifurcated capillaries in the inner layers of the retina (B 2 to B 4 in FIG. 6A ). FIG. 6A shows an example of the various layers in the retina, from the inner limiting layer B 1 to a pigmented layer B 6 . 45% of the blood that exists in blood vessels is composed of blood cell components, and of those blood cell components, about 96% are erythrocytes and about 3% are leukocytes. An erythrocyte has a diameter of about 8 μm, and a neutrophil, which is the most common type of leukocyte, is 12 to 15 μm in size.
With lifestyle-related diseases and systemic diseases such as diabetes, it is known that symptoms appear which indicate a decrease in blood fluidity (the extent to which blood flows smoothly). Specific examples of this include a decrease in blood cell deformability, and erythrocytes and thrombocytes tending to aggregate. In blood vessels, erythrocytes are constantly aggregated here and there as shown in FIG. 6C (which also shows flow direction FD), and erythrocyte aggregates DTi are formed. If the focus position is set to the photoreceptor cells and an SLO image having a high horizontal resolution is obtained, shadows will form in the vicinity of the photoreceptor cells since incident light does not pass through the erythrocytes, and an erythrocyte aggregate DTi is rendered as a dark tail DTi. On the other hand, if the blood returns to the normal state, for example, due to medical treatment, it is conceivable that the number of erythrocyte aggregates that are constantly aggregated as shown in FIG. 6D will gradually decrease. Conventionally, the number of erythrocyte aggregates flowing in blood vessels and their change over time could not be measured in a non-invasive manner.
A conventional technique of generating a spatiotemporal image for a capillary branch region in an adaptive optics SLO moving image and of measuring the degree of physiological erythrocyte aggregation based on the change in the length of an erythrocyte aggregate in the spatiotemporal image is disclosed in “Uji, Akihito, ‘Observation of dark tail in diabetic retinopathy using adaptive optical scanning laser ophthalmoscope’, Proceedings of the 66th Annual Congress of Japan Clinical Ophthalmology, p.27 (2012)” as a technique for measuring blood fluidity in a non-invasive manner.
However, in the above-described technique, the degree of erythrocyte aggregation that (temporarily) appears physiologically is measured based on the change in the length of the erythrocyte aggregate, and no technique of measuring the distribution (number according to region) of (constant) erythrocyte aggregates caused by abnormal erythrocyte aggregation that appears here and there in the blood vessel is disclosed.
Summary of the invention
An embodiment of the present invention provides an image processing apparatus and an image processing method that enable non-invasive measurement of blood fluidity based on the number of blood cell aggregates.
According to one aspect of the present invention, there is provided an information processing apparatus comprising: image obtaining unit configured to obtain a moving image of an eye area; unit configured to identify at least one region of blood cells in the obtained moving image; and determining unit configured to determine the number of identified regions of blood cells.
According to another aspect of the present invention, there is provided an information processing method comprising: an image obtaining step of obtaining a moving image of an eye area; an identification step of identifying a region of blood cells in the obtained moving image; and a determination step of determining the number of identified regions of blood cells.
Features of the present invention will become apparent from the following description of exemplary embodiments with reference to the attached drawings.
Brief description of the drawings
The accompanying drawings, which are incorporated in and constitute a part of the specification, illustrate embodiments of the invention and, together with the description, serve to explain the principles of the invention.
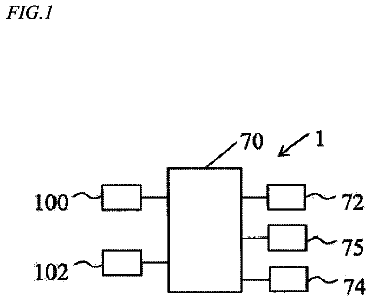
FIG. 1 is a block diagram showing an example of a functional configuration of an image processing apparatus according to a first embodiment.
FIG. 2 is a block diagram showing an example of a functional configuration of a system that includes the image processing apparatus according to an embodiment.
FIG. 3 is a diagram showing a configuration of an SLO imaging apparatus according to an embodiment.
FIG. 4 is a block diagram showing an example of a hardware configuration of an image processing apparatus according to an embodiment.
FIG. 5 is a flowchart of processing executed by the image processing apparatus according to the first embodiment.
FIGS. 6A to 6D are diagrams for describing images acquired in an embodiment and blood cell dynamics.
FIGS. 7A to 7F are diagrams for describing image processing contents according to an embodiment.
FIG. 8 is a flowchart showing measurement processing according to an embodiment.
FIG. 9 is a block diagram showing an example of a functional configuration of an image processing apparatus according to second to fourth embodiments.
FIG. 10 is a flowchart of processing executed by the image processing apparatus according to the second to fourth embodiments.
FIG. 11 is a flowchart showing measurement position determination processing according to the second to fourth embodiments.
FIGS. 12A to 12D are diagrams for describing display contents regarding values measured in an embodiment.
FIGS. 13A to 13C are diagrams for describing the contents of image processing executed by the image processing apparatus according to the fourth embodiment.
Description of the embodiments
Preferred embodiments of the image processing apparatus and method according to the present invention will be described below in accordance with the accompanying drawings. Note that the present invention is not limited to the embodiments disclosed below.
First Embodiment
An image processing apparatus according to the present embodiment is configured such that the number of blood cell aggregates in a single capillary branch in an SLO image selected by a user is measured and the measured value is displayed. Specifically, the image processing apparatus extracts a blood vessel from an SLO image Di that was obtained as a moving image, and a measurement target capillary branch is specified manually. Then, the number of blood cell aggregates is measured based on the number of blood cell aggregate paths in a spatiotemporal image generated along the specified capillary branch, and a normal value range is displayed along with the measured values.
Overall Configuration
FIG. 2 is a diagram showing a configuration of a system that includes an image processing apparatus 10 according to the present embodiment. The image processing apparatus 10 is connected to an SLO imaging apparatus 20 , a data server 40 , and a pulse data obtaining apparatus 50 via a local area network (LAN) 30 configured by an optical fiber, a USB, an IEEE 1394, or the like. Note that a configuration is possible in which these devices are connected via an external network such as the Internet, and an alternative configuration is possible in which the image processing apparatus 10 is directly connected to the SLO imaging apparatus 20 , the data server 40 , and the pulse data obtaining apparatus 50 .
The SLO imaging apparatus 20 is an apparatus that captures the SLO image Di and transmits information regarding the obtained SLO image Di and a fixation target position Fi that is used at the time of imaging to the image processing apparatus 10 and the data server 40 .
Note that if the SLO image Di is obtained at a different magnification in the present specification, it will be denoted as Dsi. That is to say, s is a variable indicating magnification and i is a variable indicating imaging position number, and they are expressed as s=1, 2, . . . , smax and i=1, 2, . . . , imax. As s increases, the imaging magnification increases (angle of view decreases). Note that in the present embodiment, a low-resolution SLO image and fixation target position where s=1 have one imaging position, and in the present specification, there are cases where they are written as D 1 and F 1 respectively.
The pulse data obtaining apparatus 50 is an apparatus that obtains biological signal data that changes autonomically, and is composed of a pulse wave meter or an electrocardiograph, for example. The pulse data obtaining apparatus 50 obtains pulse data while obtaining an SLO image Dsi according to an operation by an operator (not shown). Here, the pulse data is expressed as a sequence of points having the obtainment time t on one axis and the signal value measured by the pulse data obtaining apparatus 50 on the other axis. The obtained pulse data is transmitted to the image processing apparatus 10 and the data server 40 .
The data server 40 holds the SLO images Dsi of the examination subject eye, the fixation target positions Fsi that are used at the time of imaging, imaging condition data such as the pulse data, image characteristics of the eye area, registration parameter values for the SLO images Dsi, measured values regarding blood cell aggregate number, normal value range data for the measured values, and the like. Here, image characteristics for a capillary Q, a blood cell W, and retinal blood vessels are treated as image characteristics of the eye area in the present embodiment. Note that the SLO images Dsi and the fixation target positions Fsi that are used at the time of imaging are output by the SLO imaging apparatus 20 . The pulse data is output from the pulse data obtaining apparatus 50 . Also, image characteristics of the eye area, registration parameter values for the SLO images Dsi, and measured values regarding the blood cell aggregate size are output from the image processing apparatus 10 . Also, in response to a request from the image processing apparatus 10 , the data server 40 transmits the SLO images Dsi, the fixation target positions Fsi, the pulse data, the eye area image characteristics, the registration parameter values, the measured values, and the normal value range data for the measured values to the image processing apparatus 10 .
A functional configuration of the image processing apparatus 10 according to the present embodiment will be described next with reference to FIG. 1 . FIG. 1 is a block diagram showing the functional configuration of the image processing apparatus 10 , and the image processing apparatus 10 has an image obtaining unit 110 , a pulse data obtaining unit 120 , a storage unit 130 , an image processing unit 140 , and an instruction obtaining unit 150 . Also, the image processing unit 140 includes a specification unit 141 , a measurement unit 142 , and a display control unit 143 .
The configuration of an adaptive optics SLO (Adaptive Optics Scanning Laser Ophthalmoscope (AO-SLO)) will be described next with reference to FIG. 3 . The AO-SLO 20 has an SLD (Super Luminescent Diode) 201 , a Shack-Hartmann wavefront sensor 206 , an adaptive optics system 204 , beam splitters ( 202 , 203 ), an X-Y scanning mirror 205 , a focus lens 209 , an aperture 210 , a light sensor 211 , an image forming unit 212 , and an output unit 213 .
Light that is emitted from the SLD 201 , which is a light source, is reflected by the eye fundus, a portion of that light is input to the Shack-Hartmann wavefront sensor 206 via the second beam splitter 203 , and the rest is input to the light sensor 211 via the first beam splitter 202 . The Shack-Hartmann wavefront sensor 206 is a device for measuring eye aberrations and has a lens array 207 and a CCD 208 . When incident light passes through the lens array 207 , a cluster of light spots appears on the CCD 208 , and a wavefront aberration is measured based on the shift in the positions of the projected light spots. The adaptive optics system 204 drives an aberration correction device (a deformable mirror or a space/light phase modulator) based on the wavefront aberration measured by the Shack-Hartmann wavefront sensor 206 and corrects the aberration. The light that has undergone aberration correction is received by the light sensor 211 via the focus lens 209 and the aperture 210 . The scanning position on the eye fundus can be controlled by moving the X-Y scanning mirror 205 , and data corresponding to time (number of frames/frame rate) and the imaging target region that was designated in advance by the operator is obtained. The data is transferred to the image forming unit 212 , image deformities caused by variation in the scanning speed are corrected, luminance values are corrected, and image data (moving image or still image) is formed. The output unit 213 outputs the image data formed by the image formation unit 212 . In order to set the focus to a specified depth position in the eye fundus, at least one of the following types of adjustment can be used: adjustment using an aberration correction device in the adaptive optics system 204 , and adjustment performed by installing a focus adjustment lens (not shown) in the optical system and moving that lens.
A hardware configuration of the image processing apparatus 10 will be described next with reference to FIG. 4 . In FIG. 4 , reference numeral 301 is a central processing unit (CPU), reference numeral 302 is a memory (RAM), reference numeral 303 is a control memory (ROM), reference numeral 304 is an external storage apparatus, reference numeral 305 is a monitor, reference numeral 306 is a keyboard, reference numeral 307 is a mouse, and reference numeral 308 is an interface. The external storage apparatus 304 stores a control program for realizing an image processing function according to the present embodiment and data that is used when the control program is executed. The control program and the data are stored in the appropriate RAM 302 via a bus 309 , are executed by the CPU 301 , and function as the elements of the functional configuration shown in FIG. 1 under the control of the CPU 301 .
Functions of the blocks that configure the image processing apparatus 10 shown in FIG. 1 will be described below in association with a specific execution procedure of the image processing apparatus 10 shown in the flowchart in FIG. 5 .
Step S 510
The image obtaining unit 110 , which is an example of an image obtaining means for obtaining a moving image of an eye area, makes a request to the SLO imaging apparatus 20 to obtain an SLO image Dsi and a fixation target position Fsi. In the present embodiment, a low-magnification SLO image D 1 is obtained by setting a fixation target position F 1 to the fovea in the macular region, and a high-magnification SLO image D 2 i is obtained by setting a fixation target position F 2 i to the foveal and parafoveal regions. Note that the method for setting the imaging position is not limited to this, and a setting of any position may be used.
Also, the pulse data obtaining unit 120 makes a request to the pulse data obtaining apparatus 50 to obtain pulse data related to biological signals. In the present embodiment, a pulse wave meter is used as the pulse data obtaining apparatus, and pulse wave data is obtained from an earlobe of the examination subject. The pulse data obtaining apparatus 50 obtains the corresponding pulse data and transmits it in response to the acquisition request, and thereby the pulse data obtaining unit 120 receives the pulse wave data from the pulse data obtaining apparatus 50 via the LAN 30 and stores it in the storage unit 130 .
Here, consideration will be given to the case where the image obtaining unit 110 starts to obtain the SLO images Dsi according to the phase of the pulse data obtained by the pulse data obtaining apparatus 50 , and the case where the acquisition of the pulse data and the acquisition of the SLO images Dsi are started at the same time immediately subsequent to receiving a request to obtain the SLO images Dsi. In the present embodiment, a method is used in which the acquisition of the pulse data and the SLO images Dsi is started immediately subsequent to receiving a request to obtain the SLO images Dsi.
The SLO imaging apparatus 20 obtains the SLO images D 1 and D 2 i and the fixation target positions F 1 and F 2 i in response to the obtainment request and transmits them. The image obtaining unit 110 receives the SLO images D 1 and D 2 i and the fixation target positions F 1 and F 2 i from the SLO imaging apparatus 20 via the LAN 30 . The image obtaining unit 110 stores the received SLO images D 1 and D 2 i and the fixation target positions F 1 and F 2 i in the storage unit 130 . Note that in the present embodiment, the SLO images D 1 and D 2 i are captured moving images whose focus positions have been set near to the photoreceptor cells and whose frames have been registered.
Step S 520
The specification unit 141 performs specification of a vascular region (vascular region specification processing) in the retina from the SLO images D 2 i. In the present embodiment, the vascular region is specified in the SLO images D 2 i as the movement range of blood cell components using the following procedure.
(a) Perform subtraction processing between sequential frames of intermediate-scale images D 2 i whose frames have been registered (generate differential moving image).
(b) Calculate luminance value statistic (variance) for the frame direction at the x-y positions of the differential moving image generated in (a).
(c) Specify the region in which the luminance variance is at or above a threshold value Tv at the x-y positions of the differential moving image as the region in which blood cells are moving, or in other words, as the vascular region.
Note that the blood vessel detection processing is not limited to the method above, and any method may be used. For example, in (a) above, division processing for the luminance values between sequential frames may be used (generating a division moving image) instead of using subtraction. Alternatively, a blood vessel may be detected with the application of a filter that enhances linear structures in a specific frame of the SLO image D 1 or the SLO images D 2 i. Note that the images obtained by specifying or identifying the vascular region out of the SLO images D 2 i is denoted below as the blood vessel images V 2 i.
Step S 530
The measurement unit 142 is an example of a determining means for determining a region of blood cells in an obtained moving image, and a measuring means for measuring the number of the determined regions of blood cells. Although at least one of a blood cell, a blood cell aggregate, and a plasma region can be used as the region of blood cells, a blood cell aggregate is used in the present embodiment. Note that the plasma region is a region in a blood vessel that hardly includes any blood cells, it is identified using a blood cell aggregate, and it can be a measurement target region. In the present embodiment, the measurement unit 142 measures the number of blood cell aggregates as the number of regions of blood cells in a capillary branch in the SLO images D 2 i. Note that in the present embodiment, the user uses an interface such as a mouse to designate the measurement target capillary branch out of the vascular region specified in step S 520 . Note that the method for designating the capillary branch is not limited to this, and any publicly-known user interface may be used. The processing of the present step (blood cell aggregate number measurement) will be described in detail later with reference to the flowchart in FIG. 8 .
Step S 540
The display control unit 143 , which is an example of a display control means, displays the measured value for the number of blood cell aggregates that was obtained in step S 530 , and a diagram generated based on that measured value on the monitor 305 .
In the present embodiment, a graph (such as that shown in FIG. 12B ) in which a normal value range has been plotted with the capillary branch number on the horizontal axis and the number of blood cell aggregates on the vertical axis is displayed as a graph indicating the number of blood cell aggregates with respect to the selected capillary branches by the display control means 143 in the SLO images D 2 i. FIG. 12B shows a display mode in which the above-mentioned measurement results are plotted, with the vascular branch (Vn) on the horizontal axis, and the measured number of blood cell aggregates (Nd) on the vertical axis. Note that in FIG. 12B , Ra is the abnormal value range, Rb is the border between the abnormal value range and the normal value range, Rn is the normal value range, and My is the number of blood cell aggregates measured in the vascular branch. Displaying the distribution of measured values in this way makes it possible easily to check whether or not there is a problem by comparing the number of blood cell aggregates with the normal value range. Note that the number of blood cell aggregates per pulse data cycle (or per second) at a specific position in the measurement target capillary branch (in the present embodiment, the central point of a vascular branch) is displayed as the measured values for the number of blood cell aggregates.
Note that the display control is not limited to this, and any kind of display may be performed as long as it is based on the measured values for the number of blood cell aggregates. For example, a distribution of numbers of blood cell aggregates, or a distribution of differences between the measured values for the number of blood cell aggregates and a statistical value (average value of measured values, or the like) may be displayed.
Step S 550
The instruction obtaining unit 150 obtains an instruction from the exterior about whether or not to store the SLO images D 1 and D 2 i, the fixation target positions F 1 and F 2 i, pulse wave analysis data, the blood vessel images V 2 i, the measurement target positions, and measured values for the number of blood cell aggregates in the data server 40 . This instruction is input by the operator via the keyboard 306 or the mouse 307 for example. If storage is instructed, the procedure moves to the processing of step S 560 , and if storage is not instructed, the procedure moves to step S 570 .
Step S 560
The image processing unit 140 transmits the examination date/time, information for identifying the examination subject eye, the SLO images D 1 and D 2 i, the fixation target positions F 1 and F 2 i, the pulse wave analysis data, the blood vessel images V 2 i, the measurement target position, and measured values for the numbers of blood cell aggregates to the data server 40 , where they are stored in association with each other.
Step S 570
The instruction obtaining unit 150 obtains an instruction from the exterior (e.g. from an operator) regarding whether or not to end the processing related to the SLO images D 2 i performed by the image processing apparatus 10 . This instruction is input by the operator via the keyboard 306 or the mouse 307 . If an instruction to end processing is obtained, the processing ends. On the other hand, if an instruction to continue processing is obtained, the procedure returns to the processing of step S 510 and processing for the next examination subject eye (or re-processing for the same examination subject eye) is performed.
The details of the measurement processing executed in step S 530 will be described next with reference to the flowchart shown in FIG. 8 .
Step S 810
The measurement unit 142 generates a spatiotemporal image such as that shown in FIG. 7E or FIG. 7F with the vascular branch that was determined as the measurement target. The spatiotemporal image includes the position (Pt) in the vascular branch on its horizontal axis, the scanning time (T) on its vertical axis, and corresponds to the fact that a curved cross section (see FIG. 7D ) of the SLO moving images (whose frames have been registered) is generated along the designated vascular branch. Note that the horizontal axis of the spatiotemporal image is set such that the side that is closer to the origin is the upstream side. The graphs in FIGS. 7E and 7F also show the pulse cycle Pw associated with the vascular branch position Pt and obtained by the pulse data obtaining apparatus 50 .
The spatiotemporal image includes low-luminance linear components indicating the movement of erythrocyte aggregates, and high-luminance linear components (PGi in FIGS. 6C and 6D ) indicating the movement of leukocytes or plasma regions (plasma regions that hardly contain any erythrocytes, also referred to as plasma-gaps).
Step S 820
The measurement unit 142 determines a region of blood cells (a blood cell aggregate in the present example) in the specified vascular region (the specified vascular branch in the present example). The measurement unit 142 of the present embodiment detects a measurement target blood cell aggregate (DTi in FIGS. 6C and 6D ) in the spatiotemporal image generated in step S 810 . In the present embodiment, since erythrocyte aggregates are present adjacent to plasma regions (plasma gaps) (or behind leukocytes), high-luminance movement paths are first detected in the spatiotemporal image and erythrocyte aggregates are detected by detecting dark tails adjacent to the high-luminance movement paths.
In other words, a location that is adjacent to a region having luminance values exceeding a first threshold value, and that has a luminance value that is lower than a second threshold value in the specified vascular region is determined as a region of blood cells. More specifically, line enhancement is performed using a publicly-known line enhancement filter, and the high-luminance path is subsequently detected by binarizing using a threshold value Tt 1 . Furthermore, the low-luminance blood cell aggregate path is detected by binarizing the dark tail adjacent to the detected high-luminance path using a threshold value Tt 2 . Note that the method for detecting the blood cell aggregate is not limited to the above-described method, and any image processing method may be used. Also, the movement path of the erythrocyte aggregate may be specified by directly detecting a dark tail using threshold value processing or the like.
Step S 830
The measurement unit 142 measures the number of erythrocyte aggregate paths that were detected and selected in step S 820 . Here, since consideration is given to the influence of the heartbeat, the paths of erythrocyte aggregates that are present in phase sections corresponding to an integral multiple of pulse data cycles are selected as the measurement targets out of the detected erythrocyte aggregate paths. In the present embodiment, as shown in FIGS. 7E and 7F , erythrocyte aggregate paths that are included in phase sections corresponding to two cycles of pulse data Pw at the central point of a vascular branch (dotted line region in the vertical direction of the spatiotemporal image) are selected as the measurement targets. It is measured as 1.5 per cycle in FIG. 7E and 2.5 per cycle in FIG. 7F .
Note that the measurement unit 142 obtains pulse data corresponding to the SLO images D 2 i in advance from the storage unit 130 and detects the peak values of the pulse data. Also, the measured values for the number of blood cell aggregates may be calculated based on a value obtained by directly measuring the size of the blood cell aggregate in a frame of the video configured by the SLO images D 2 i without the spatiotemporal image being generated. Alternatively, rather than using a fixed number of cycles starting from the measurement start time, the number of erythrocyte aggregates in a section corresponding to a fixed number of seconds may be measured, and the number of blood cell aggregates per second may be measured.
According to the above configuration, the image processing apparatus 10 measures the number of blood cell aggregates (number of regions of blood cells) in a capillary branch that was determined manually, and displays the measured values. Accordingly, blood fluidity can be measured non-invasively based on the number of blood cell aggregates.
Second Embodiment
The first embodiment described a configuration in which the measurement target capillary branch is selected manually. The second embodiment will describe an image processing apparatus that automatically determines a capillary branch that is appropriate for measuring the number of blood cell aggregates and subsequently measures the number of blood cell aggregates in the capillary branch and displays the distribution of the measured values.
Specifically, a composite image is generated by compositing blood vessel images obtained by extracting blood vessels from the SLO images Dsi. The image processing apparatus 10 specifies a parafoveal region based on the shape of an avascular region detected in the composite blood vessel image and extracts vascular branch candidates by determining vascular bifurcation positions in the parafoveal region. Then, a measurement target vascular branch is specified based on the shapes of the extracted vascular branch candidates, the number of blood cell aggregates is measured based on the number of blood cell aggregate paths in the spatiotemporal image that was generated using the specified vascular branch, and the measured values are displayed as a map.
The configuration of devices that are connected to the image processing apparatus 10 according to the second embodiment is similar to that in the case of the first embodiment, and therefore the description will not be repeated. FIG. 9 shows functional blocks of the image processing apparatus 10 . The image processing unit 140 differs from that of the first embodiment ( FIG. 1 ) in that it includes a registration unit 144 and a measurement position determination unit 145 .
Image processing executed by the image processing apparatus 10 according to the second embodiment will be described below with reference to the flowchart in FIG. 10 . Note that the processing of steps S 1010 and S 1090 in FIG. 10 is the same as the processing of steps S 510 and S 570 in the first embodiment ( FIG. 5 ), and the description will not be repeated.
Step S 1020
The registration unit 144 registers the SLO image D 1 and the SLO images D 2 i and obtains the relative positions of the SLO images D 2 i in the SLO image Dl. Note that if there is an overlapping region in the SLO images D 2 i, the degree of image similarity is first calculated for the overlapping region, and the positions of the SLO images D 2 i are registered at the position at which the degree of image similarity is the largest.
Also, if three or more SLO images with different magnifications are obtained in step S 1010 , registration is performed in sequence starting from the SLO image having the lowest magnification. For example, if the SLO image D 1 , the SLO images D 2 i, and SLO images D 3 i are obtained, registration between the SLO image D 1 and the SLO images D 2 i is performed, and subsequently, registration between the SLO images D 2 i and the SLO images D 3 i is performed.
Note that the registration unit 144 obtains the fixation target positions F 2 i that is used at the time of capturing the SLO images D 2 i from the memory unit 130 and uses them as the initial points in the search for registration parameters in the registration between the SLO image D 1 and the SLO images D 2 i. Also, any suitable method can be used as the method for image similarity degree and coordinate conversion, and in the present embodiment, registration is performed using a correlation coefficient for the degree of image similarity and Affine conversion is used as the coordinate conversion method.
The composite image of the SLO images D 2 i is generated using information regarding the relative positions of the SLO images D 2 i on the SLO image D 1 that were obtained in the present step.
Step S 1030
Processing that is basically similar to that of step S 520 in the first embodiment is performed. That is to say that the specification unit 141 specifies a vascular region in the retina in the SLO images D 2 i. Also, the specification unit 141 generates a composite image of the blood vessel images V 2 i using the registration parameter values obtained in step S 1020 .
Step S 1040
The measurement position determination unit 145 automatically determines a capillary branch that is to be the target for measuring the number of blood cell aggregates. The automatic determination includes information obtainment processing for obtaining the vascular diameters of multiple vascular branches that include multiple vascular bifurcations in the obtained moving image, and determination processing for determining vascular branches having vascular diameters that fall within a predetermined range among the multiple vascular branches as the measurement targets. The processing of the present step will be described in detail later with reference to the flowchart in FIG. 11 .
Step S 1050
The measurement unit 142 measures the number of blood cell aggregates by performing processing that is similar to that in steps S 810 to S 830 in the first embodiment. Also, in the second embodiment, a simple index suggesting a decrease in blood fluidity is calculated based on the value of the number of blood cell aggregates measured in the measurement target vascular branch. For example, “the percentage of the sum of the lengths of blood vessels containing a region of blood cells, or of blood vessels that do not contain a region of blood cells, with respect to the sum of the lengths of measurement target blood vessels” will be used as such an index. In other words: (sum of lengths of measurement target vascular branches through which erythrocyte aggregates pass)/(sum of lengths of measurement target vascular branches)
or (sum of lengths of measurement target vascular branches through which erythrocyte aggregates do not pass)/ (sum of lengths of measurement target vascular branches)
is calculated. This index utilizes the fact that there are few vascular branches through which erythrocyte aggregates pass (vascular branches in which erythrocyte aggregates are present) in a healthy eye, and the fact that the number of vascular branches through which erythrocyte aggregates pass (number of vascular branches in which erythrocyte aggregates are present) increases as blood fluidity decreases. Index
increases and index
decreases as blood fluidity decreases.
Alternatively, “a value obtained by dividing the sum of the lengths of blood vessels that do not include regions of blood cells by the area of a region of interest” may be used as the above-described index. In other words: (sum of lengths of measurement target vascular branches through which erythrocyte aggregates do not pass)/ (area of measurement target region (ROI))
may be calculated.
Index
not only reflects a decrease in blood fluidity, but also the progression of vascular obstruction. The smaller the value is, the more it indicates that the blood fluidity has decreased and vascular obstruction has progressed.
Note that the following method may be used as the method for measuring the number of blood cell aggregates in step S 830 . In other words, a blood cell aggregate path in the case where the pulse data is in a specific phase section is used as the measurement target, and a statistical value for the measured values is calculated. For example, the number of blood cell aggregates present in the vascular branches at multiple end-diastolic scanning times such as those indicated by the horizontal dotted lines in FIGS. 7E and 7F is measured and an average value and a variance are obtained. By using the average value, the measurement accuracy can be improved compared to the case of using a singular measurement value, and furthermore, the inverse of the variance value for example can be used as reliability degree for the measured values. Note that if the variance value is less than a threshold value Tc (or equal to 0), the largest pre-set value for reliability degree is allocated. In FIG. 7E , the average value for the number of blood cell aggregates is 1 and the variance is 0, and in FIG. 7F , the average value is (2+2+1)/3≈1.67, and the variance is about 0.22.
Also, the measured value is not limited to the number of blood cell aggregates in the measurement target vascular branches, and a deviation from a normal value may be calculated based on a normal value range for the number of blood cell aggregates, for example.
Step S 1060
The display control unit 143 displays the measured value for the number of blood cell aggregates that was obtained in step S 1050 , and a display mode generated based on that measured value on the monitor 305 .
The description continues in the full USPTO document.
 Lapsed, fee not paid5 drawings