Technical field
The present invention relates to a nucleic acid analysis device.
Background art
Recently, next-generation DNA sequencers have attracted attention as sequencing techniques for DNA nucleotide sequences (DNA sequencing) which have a higher parallel processing capability than DNA sequencers by Sanger method using capillary electrophoresis. Next-generation DNA sequencers achieve ultra-parallel processing by extending DNA fragments to be sequenced spotted highly densely on a substrate and detecting the luminescence of the extension reaction.
NPL 1 discloses a DNA sequencing technique of a next-generation DNA sequencer based on fluorescence detection. Reaction spots in which identical DNA fragments are clustered densely by amplification treatment are arranged highly densely on a glass sample substrate. When four kinds of base (A, T, G and C) labeled with four kinds of fluorophore are introduced to the substrate, a base complementary to that of the DNA fragments is incorporated by extension reaction by polymerase. Because the 3′-terminal of each fluorescently labeled base is modified with a functional group (terminator) for inhibiting the extension reaction, only one base is incorporated in one DNA fragment. After the extension reaction, excess free bases are washed out, and then the fluorescence emitted from each reaction spot is detected as a fluorescent spot and the kind of fluorophore is identified by the color. After the fluorescence detection, the terminator and the fluorophore are removed from each DNA fragment by chemical reaction so that the next base would be incorporated. By repeating the extension reaction, fluorescence detection and removal of the terminator one by one, about 100 bases of the sequence of the DNA fragments are determined.
NPL 2 discloses a DNA sequencing technique of a next-generation DNA sequencer based on detection of chemical luminescence (pyrosequencing). Beads which each have a diameter of about 30 μm wand carry identical DNA fragments fixed thereon by amplification treatment are contained in wells each having a diameter of about 50 μm. A closely packed honeycomb structure of reaction spots having such a well structure is on a sample substrate. The substrate faces an image sensor through optic fibers and is fixed in such a way that the light from a reaction spot is always detected by a same pixel of the image sensor. Although this structure makes sequencing easy, it is difficult to scan two or more fields and process the data in parallel. When a kind of base (for example A) is introduced to a DNA fragment on a bead, the base is incorporated by the extension reaction by polymerase when the complementary base is A. Because the beads are surrounded by a luciferase luminescent agent which emits light by pyrophosphoric acid, the extension can be recognized by detecting the luciferase luminescence emitted from the reaction spots while the extension reaction progresses by the image sensor. Theoretically, the luciferase luminescence amount is in proportion to the amount of pyrophosphoric acid, and thus a luciferase luminescence amount in proportion to the number of incorporated bases is detected in case of a homopolymer. By repeating the above extension reaction for A, T, G and C, around 400 bases of the sequence of the DNA fragments are determined. Because no terminator is used in the above method, it is necessary to introduce the four kinds of base separately to the substrate. CITATION LIST Non Patent Literature
NPL 1: D. R. Bentley et al., Accurate whole human genome sequencing using reversible terminator chemistry, Nature 456, 53-59
NPL 2: M. Margulies et al., Genome sequencing in microfabricate high-density picoliter reactors, Nature 437, 376-380
SUMMARY OF INVENTION Technical Problem
The next-generation DNA sequencer of NPL 1 has a high parallel processing capacity due to the micro-size reaction spots and the highly dense arrangement thereof, but has its drawback that the read base length is short (100 bases or shorter). This is because of its poor reaction efficiency for removing the terminator, since the terminator is used and the extension reaction is stopped after each base (even if the reaction efficiency is 99%, the signal intensity becomes about ⅓ at 100th base). In addition, when the reaction time is made longer to conduct the removal reaction sufficiently, the sequencing time becomes longer. On the other hand, because the next-generation sequencer of NPL 2 does not use any terminator, a long read base length (400 bases or longer) can be achieved. However, the sequencer has its drawback of poor parallel processing capability for the following two reasons. The first reason is that biochemical luminescence is weaker than fluorescence and thus the sizes of the reaction spots cannot be reduced. The second reason is that scanning is not possible because the lights from the reaction spots should enter the image sensor elements through the optic fibers so that the luminescence from a reaction spot is always detected in the same position of the image sensor. As described above, because biochemical luminescence is weaker than fluorescence, the detection sensitivity thereof is lower than that of fluorescence detection. Accordingly, the sequencing accuracy of the next-generation sequencer of NPL 2 is poor.
As described above, there is no example of a next-generation sequencer which uses fluorescence detection and which can achieve a long read base length, a high parallel processing capability and a high sequencing accuracy at the same time. Solution to Problem
The invention provides a technique for DNA sequencing by conducting sequential extension reaction without using any terminator and real-time detection of fluorescence. A structure and the means for achieving the technique are as follows:
a nucleic acid analysis device having:
a flowcell in which two or more DNA fragment clusters of two or more DNA fragments having identical nucleotide sequences are immobilized, wherein at least a part of the flowcell is made of a transparent material;
an irradiation unit for irradiating a part in which the DNA fragment clusters are immobilized;
a lens for collecting fluorescence; and
a light-detection element for detecting a collected light:
which is characterized in that a solution containing only dATP having a fluorescently modified phosphate terminal among four bases, a solution containing only dCTP having a fluorescently modified phosphate terminal among the four bases, a solution containing only dGTP having a fluorescently modified phosphate terminal among the four bases, a solution containing only dTTP having a fluorescently modified phosphate terminal among the four bases, and a buffer solution for washing out the bases are sent sequentially to the part in which the DNA fragment clusters are immobilized. Advantageous Effects of Invention
A next-generation DNA sequencer having a long read base length, a high parallel processing capability and a high sequencing accuracy is provided.
Brief description of drawings
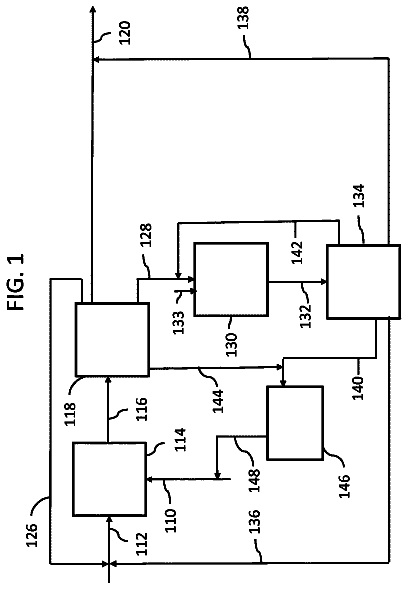
FIG. 1 shows a device structure of Example 1.
FIGS. 2( a ) and 2( b ) shows structures on a sample substrate 210 constituting a flowcell 110 of Example 1.
FIG. 3 shows a structure of the flowcell 110 of Example 1.
FIGS. 4( a ), 4( b ), 4( c ) and 4( d ) show schematic diagrams of a sequential extension reaction.
FIGS. 5( a ) and 5( b ) show time-changes in pixel value in pixel positions with reaction spots 105 .
FIGS. 6( a ) and 6( b ) show charts drawn by plotting standardized changes in fluorescence intensity of respective extension reactions, with respect to two reaction spots, namely a reaction spot 1 and a reaction spot 2 .
FIG. 7 is a flowchart of a sequencing cycle.
FIG. 8 is a flowchart of base calling of the reaction spots 105 .
FIGS. 9( a ) and 9( b ) show another embodiment 1 of the flowcell and a solution-sending unit.
FIG. 10 is a second embodiment of the flowcell and the solution-sending unit.
FIG. 11 is a structure around the flowcell 110 of Example 2.
FIG. 12 is a flowchart of parallel processing of a sequencing cycle with two or more flow paths.
FIG. 13 is a third embodiment of the flowcell.
FIG. 14 is a fourth embodiment of the flowcell.
FIGS. 15( a ) and 15( b ) show A structure around a driving unit 761 and the flowcell of Example 3, and a relation of an observation field and the head of a solution, respectively.
FIG. 16 is a flowchart of a sequencing cycle of TDI driving.
FIG. 17 is a flowchart of a sequencing cycle of step driving.
FIGS. 18( a ) and 18( b ) show another embodiment of the flowcell in Example 3.
FIG. 19 is a structure around the flowcell of Example 4.
FIGS. 20( a ) and 20( b ) show the principle of a solution-sending method in Example 4.
FIGS. 21( a ) and 21( b ) show another embodiment of the flowcell in Example 4.
FIG. 22( a ) is an example in which two detection units 120 and two irradiation units 112 are provided; and FIG. 22 ( b ) is another arrangement of the detection units and the irradiation units.
FIG. 23 shows another embodiment of Example 5.
FIG. 24 shows changes in pixel value during the extension reaction of the reaction spots 105 , for a case in which non-labeled bases were mixed and a case in which the non-labeled bases were not mixed.
FIG. 25 is an embodiment of the flowcell and the solution-sending unit when non-labeled bases are used after sending respective solutions of fluorescently labeled bases.
FIG. 26 is a flowchart of a sequencing cycle in which non-labeled bases are used after sending respective solutions of fluorescently labeled bases.
FIGS. 27( a ), 27( b ) and 27( c ) show an embodiment of Example 7.
FIG. 28 shows a structure of the irradiation unit and the detection unit of Example 8.
FIG. 29 shows another embodiment of the irradiation unit of Example 8.
FIG. 30 shows another embodiment of the irradiation unit of Example 8.
FIG. 31 shows another embodiment of the detection unit of Example 8.
FIGS. 32( a ), 32( b ) and 32 ( c ) show a structure around the sample substrate 210 of Example 9.
FIGS. 33( a ), 33( b ), 33( c ) and 33( d ) show schematic diagrams of a sequential extension reaction using fluorescence resonance energy transfer (FRET) in Example 10.
FIG. 34( a ) is a structure of the detection unit in Example 10; and FIG. 34( b ) shows time-changes in pixel value during an extension reaction of a reaction spot.
FIGS. 35( a ), 35( b ), 35( c ) and 35( d ) show another embodiment of Example 10.
FIGS. 36( a ), 36( b ), 36( c ) and 36( d ) show another embodiment of Example 10.
FIG. 37 shows a structure around an image sensor 134 and a cover substrate 301 in Example 11.
FIG. 38 shows another embodiment of Example 11.
FIGS. 39( a ) and 39( b ) show another embodiment of Example 11.
FIG. 40 shows changes in pixel value during extension reaction of a reaction spot 105 measured by image sensors 134 g and 134 f in Example 12.
FIGS. 41( a ), 41( b ), 41( c ), 41( d ), 41( e ) and 41( f ) show schematic diagrams of a sequential extension reaction using fluorescence resonance energy transfer (FRET) in Example 13.
FIG. 42( a ) is a structure of the detection unit and the irradiation unit in Example 13; and FIG. 42( b ) shows time-changes in pixel value during an extension reaction of a reaction spot.
FIG. 43 shows another embodiment of the detection unit of Example 13.
Description of embodiments
New characteristics and benefits of the invention are explained below referring to the drawings. In this regard, however, the drawings are solely for the explanations and do not limit the scope of the invention. Example 1
(Device Structure)
The device structure of Example 1 is shown in FIG. 1 . The device is composed of an irradiation unit 112 , a flowcell 110 , a detection unit 120 , a solution-sending unit 104 , a controller PC 101 and a waste-fluid tank 102 d . First, the irradiation unit 112 and the detection unit 120 are explained in order in which the light travels.
Only when a light-blocking shutter 140 is open, an excitation light emitted from a light source 111 is separated from unnecessary wavelength components by an excitation filter 113 and leaves the irradiation unit 112 while being focused by a condenser lens 119 , and the excitation light then enters a total reflection prism 137 perpendicularly. The excitation light which has passed through the total reflection prism 137 passes through a matching material filling the gap between the total reflection prism 137 and a sample substrate 210 constituting the flowcell 110 ( FIG. 2 ) and is completely reflected by the interface between the sample substrate 210 constituting the flowcell 110 and a solution filling on the substrate, and the excitation light then exists from the total reflection prism 137 and enters a terminal. A near field (evanescent field) generated on the surface of the sample substrate 210 by the total reflection excites the fluorophores on the surface of the sample substrate 210 . The lights on the substrate are collected by an objective lens 121 in the detection unit 120 and separated from a scattered component of the excitation light by a detection filter 122 , and only the fluorescent components pass through an imaging lens 130 and form an image on an image sensor 134 as fluorescent spots. The image sensor 134 successively obtains fluorescent images and sent the data to the controller PC 101 .
Specific conditions for Example 1 are as follows, although other conditions are also acceptable: Cy3 was used as the fluorophore, a lens with a numerical aperture of 0.75 (×20) was used as the objective lens 121 , and a semiconductor laser which successively oscillates at 532 nm was used as the light source 111 . A band-pass filter which transmits only the fluorescence from Cy3 was used as the detection filter 122 . A CMOS sensor having a detection element size of 2560×2160 pixels and a pixel size of 6.5 μm was used as the image sensor 134 . Because the focal length of the imaging lens 130 is 180 mm and the image magnification is ×20, the observation field is 832×702 μm in size. In order for the evanescent field to surround the observation field, the condenser lens 119 was moved back and forth in the optical axis direction and the size of the excitation beam entering the sample substrate 210 was adjusted. The image sensor 134 obtained fluorescent images with a time interval of 100 Hz.
A Z-axis driving unit 138 is a driving stage for focusing the objective lens 121 . The Z-axis driving unit 138 is controlled by the controller PC 101 . The Z-axis driving unit 138 can focus automatically using a fluorescent image out of focus. In addition, the driving range is set for each device in order to prevent the objective lens 121 from colliding with the flowcell 110 .
The matching material and the terminal are not shown in FIG. 1 . Synthetic quartz was used for the total reflection prism 137 and glycerol was used as the matching material. Other transparent materials such as BK7 can be used for the total reflection prism 137 . It is appropriate that the matching material be a transparent material having a refractive index between the refractive indexes of the total reflection prism 137 and the sample substrate 210 . For example, when PDMA is used as the matching material, the matching material does not drip on the device, resulting in an effect of improving the operability. Provision of the terminal results in an effect of preventing the stray light caused from the excitation light in the device.
The light-blocking shutter 140 is controlled by the controller PC 101 and closed to prevent the excitation light from reaching the sample substrate 210 when fluorescence is not detected. This has an effect of preventing the photodamage of a polymerase 401 ( FIG. 4 ) on the sample substrate 210 . Another method which does not use the light-blocking shutter 140 is a method in which the power supply of the light source 111 is turned on and off by switching. This method can achieve a similar effect.
In this Example, total reflection illumination was used to form the evanescent field. This has an effect of inhibiting the background light caused by the excitation of free fluorophores in the solution. In addition to total reflection illumination, oblique illumination has a similar effect. As another illumination method, epi-illumination may be also used.
FIG. 2 shows structures on the sample substrate 210 constituting the flowcell 110 . Reaction spots 105 in which identical DNA fragments 201 are clustered together are distributed at random on the sample substrate 210 , or the reaction spots 105 may be arranged in lattice. The reaction spots 105 may be beads 204 on which the identical DNA fragments 201 are immobilized as in FIG. 2( a ) , or may be formed by clusters of the identical DNA fragments 201 as in FIG. 2( b ) . The individual beads 204 are preferably 500 nm or less in diameter. A method for producing the beads is described in NPL 2. A method for producing the clusters is described in NPL 1. A DNA sequencing method by sequential extension reaction is described below.
FIG. 3 shows a structure of the flowcell 110 . The flowcell 110 is an integrated reaction device having five solution inlets 308 , one solution outlet 309 and a flow path 311 for sending solutions, and has a structure in which a cover substrate 301 , a spacer 306 , wherein a part of the spacer is hollowed, and the sample substrate 210 are attached. The flow path 311 is formed by the cover substrate 301 , the hollow of the spacer 306 and the sample substrate 210 . Reaction solutions are introduced from the solution inlets 308 and discharged from the solution outlet 309 . The sample substrate 210 is not limited, but the material thereof is an inorganic material such as glass, sapphire and quartz, or a highly thermally conductive resin material added with carbon fibers or inorganic fillers. The thickness of the sample substrate 210 is not limited, but a thickness of 10 mm or less is desirable to improve the thermal conductivity. The spacer 306 is not limited, but an epoxy adhesive such as thermo-curable and photo-curable epoxy adhesives, an acrylic adhesive or the like can be used. A double-sided tape containing an acrylic resin as a base or the like can be also used. A more preferable material is polydimethylsiloxane, which has higher adhesion strength to glass, quartz, sapphire or a transparent resin. As the spacer becomes thinner, the volume in the flow path can be reduced and the amounts of the reagents used can be reduced. In addition, a thickness of 50 μm or less is desirable. It is desirable to use a cover glass material for a fluorescence microscope with a thickness of 0.17 μm for the cover substrate 301 .
Although a temperature-regulating mechanism 184 is provided around the flowcell 110 , the temperature-regulating mechanism 184 is not shown in FIG. 1 . In this Example, the temperature is regulated at 37° C., at which the enzyme reaction is most active. It is possible to bring a metal plate with a Peltier element as the temperature-regulating mechanism 184 into contact with a part of the flowcell 110 except for the light path, or it is also possible to attach a transparent electrically conductive film containing indium tin oxide as the temperature-regulating mechanism 184 to the flowcell 110 . Warm wind may be also blown towards the flowcell 110 .
The structure of the solution-sending unit 104 is explained. The solution-sending unit 104 is composed of five solution tanks 102 a , 102 t , 102 g , 102 c and 102 b and solution-sending pumps 103 a , 103 t , 103 g , 103 c and 103 b . The five solution tanks, the solution-sending pumps and the five solution inlets 308 are connected with pipes. At the command given to the solution-sending pumps from the controller PC 101 connected thereto, one solution-sending pump is driven at a time to send a solution to the flowcell 110 . A waste fluid pushed out from the flowcell 110 is discharged from the solution outlet 309 and stored in the waste-fluid tank 102 d . A buffer solution containing the polymerase 401 and base A having a fluorescently modified phosphate terminal is contained in the solution tank 102 a . A buffer solution containing the polymerase 401 and base T having a fluorescently modified phosphate terminal is contained in the solution tank 102 t . A buffer solution containing the polymerase 401 and base G having a fluorescently modified phosphate terminal is contained in the solution tank 102 g . A buffer solution containing the polymerase 401 and base C having a fluorescently modified phosphate terminal is contained in the solution tank 102 c . A washing buffer solution only is contained in the solution tank 102 b . Although the polymerase 401 is contained in the four solution tanks above, the polymerase 401 may be contained in only one of the solution tanks. In addition, a sixth solution tank and a sixth solution inlet may be provided separately. The concentrations of the fluorescently modified bases are desirably 50 to 500 nM. The composition of the buffer solution is 50 mM ACES, pH 7.1, 75 mM, potassium acetate and 5 mM dithiothreitol, 1× protocatechuate dioxygenase, 4 mM protocatechuic acid and 6 mM nitrobenzoic acid (Sigma-Aldrich, St. Louis, Mo.), 0.5 mM manganese acetate, or the like, but a solution capable of conducting enzyme reaction similarly is also acceptable. The above solutions contain a scavenger for removing a dissolved enzyme. By the dissolved enzyme and continuous irradiation with the excitation light, the fluorophores gradually lose their colors. The scavenger has an effect of preventing the discoloration.
The individual fluorophore is attached to a phosphate terminal through a linker. Methods for modifying the phosphate terminals are described in Brent A. Mulder et al., Nucleic Acids Research, 2005, Vol. 33, No. 15, 4865-4873, and Jonas Korlach et al., Nucleosides, Nucleotides and Nucleic Acids, 27:1072-1083, 2008.
(Principle of DNA Sequencing)
FIG. 4 is a schematic diagram of the sequential extension reaction. The extension reaction is explained, focusing on one of the DNA fragments 201 in a reaction spot 105 . Before the initiation of the reaction, the DNA fragment 201 is in a state in which a primer is hybridized with a single-strand DNA to be sequenced ( FIG. 4( a ) ). The extension reaction progresses from the 3′-terminal of the primer. The surrounding area is filled with the buffer solution. The polymerase 401 and a base (A in the figure) in which the phosphate terminal is labelled with a fluorophore (chromophore) through a linker (the enlarged view of the base structure in FIG. 4 ( b ) ) are introduced from the solution tank 102 a to the substrate ( FIG. 4( b ) ). Because base A is complementary to the base (T) next to the 3′-terminal of the primer, the base A is captured by the polymerase 401 and detected as a fluorescent bright point ( FIG. 4( c ) ). Then, the phosphate group is removed with the completion of the extension reaction, and the fluorophore thus floats and is not detected as a fluorescent bright point any more ( FIG. 4( d ) ). Because there is no terminator, the extension reaction of the DNA fragment 201 progresses when there is the next complementary base. Accordingly, when four kinds of fluorescently labeled base are sequentially introduced to the sample substrate 210 and the increase in fluorescence intensity of the reaction spot 105 is then observed, it means that the DNA fragment has extended. Although the four kinds of base are labeled with Cy3 fluorophores, other fluorophores may be used.
FIG. 5 shows time-changes in pixel value in pixel positions with the reaction spots 105 . The chart (a) shows the case when the fragments have extended at the reaction spot 105 , while the chart (b) shows the case when the fragments have not extended at the reaction spot 105 . In case (a), almost at the same time the fluorescently labeled bases A are introduced to the sample substrate 210 , the bases A reaches the reaction spot 105 and the extension reaction progresses. Thus, the pixel value increases rapidly from the pixel value before the introduction of the bases A (called baseline; about 30 ADU) due to the fluorescence from the reaction spot 105 . Then, the fluorescence intensity decreases gradually because the number of unreacted DNA fragments reduces, and the pixel value of the reaction spot 105 decreases to the baseline when the bases A are washed out with a washing solution introduced. On the other hand, in case (b), because the extension reaction does not progress, the pixel value increases due to free bases and non-specific binding of the free bases to the reaction spot 105 and then decreases to the baseline simultaneously with the introduction of the washing solution. When the pixel value of the pixel without the reaction spot 105 is set as the background light intensity, the change in fluorescence intensity is i) a value calculated by subtraction of the background light intensity from the maximum pixel value, or ii) a value calculated by subtraction of the integral of the background light intensity over the period from the introduction of the bases to washing out of the bases from the integral of the pixel intensity over the same period. It can be recognized that the extension reaction has progressed when the change in fluorescence intensity exceeds the threshold.
FIG. 6 contains charts drawn by plotting the standardized changes in fluorescence intensity for respective extension reactions, with respect to two reaction spots, namely a reaction spot 1 and a reaction spot 2 . Although only five extension reaction cycles of A, T, G and C are shown in the charts, 100 or more extension reaction cycles are conducted. The standardization was conducted by multiplying the change in fluorescence intensity during each extension reaction by the change in fluorescence intensity during single-base extension. In case of a homopolymer, because an intensity change of several-fold of the number of the extended bases is obtained, the vertical axis of the charts corresponds to the extended base number. In FIG. 6 , the numbers of extended bases are indicated over the histogram bars for the cases in which the changes in fluorescence intensity exceeded the thresholds.
(Flowchart of DNA Sequencing)
FIG. 7 is a flowchart of the extension reaction cycle. The extension reaction cycle is a process for obtaining fluorescent images for DNA sequencing. The entire flow is automatically controlled by the controller PC 101 . This flowchart is on the assumption that the reaction spots 105 as shown in FIG. 2 are formed on the sample substrate 210 filled with the buffer solution. According to this flowchart, the extension reaction cycle is conducted.
Supplemental explanations for each step in the flowchart are as follows: the fluorescent spots shown in the step 603 are fluorescent images of the fluorescence from the reaction spots 105 . The threshold Th1 in the step 603 was as follows: Th1=(average of all pixel values)+4×(standard deviation of all pixel values). In the step 604 , Th0 is a threshold for determining that the extension reaction has been finished. Although Th0=0.1 here, an optional value can be set. Although the “average of three successive frames” is used for the condition, the number of the frames may be two or less, or four or more. Although the solution is sent until the condition “average derivative of three successive frames<Th0” is met in the step 605 , the solution sending may be stopped as long as the solution in the flowcell 110 is sufficiently replaced with that from the solution tank 102 i in the step 601 . In this regard, however, continuous sending of the solution has an effect of preventing non-specific adsorption. In addition, the flow of the solution sent can lay the DNA fragments 201 and bring the DNA fragments 201 close to the surface of the sample substrate 210 . From this, the DNA fragments 201 can be placed in the evanescent field where the excitation intensity is high, resulting in an effect of increasing the fluorescence intensity. When the time required until “average derivative of three successive frames<Th0” is met is known in advance, the steps 603 to 605 may be skipped and the images may be obtained for a certain period of time from the initiation of solution sending.
FIG. 8 is a flowchart of base calling of the reaction spots 105 . In accordance with this flowchart, the fluorescent images obtained in the sequencing cycles were analyzed and the nucleotide sequence of each reaction spot 105 was determined.
(Other Embodiments of Flowcell and Solution-Sending Unit)
Embodiments of the flowcell 110 and the solution-sending unit 104 other than the above embodiments are shown. FIG. 9 is another embodiment 1 of the flowcell 110 and the solution-sending unit 104 . The solution in the flow path 311 is sucked with a pump 901 interposed between the solution outlet 309 and the waste-fluid tank 102 d and a solution is thus sent. Because the number of pump can be reduced to one in this method, the cost can be cut. In FIG. 9 ( a ) , the embodiment is characterized in that the solution tanks 102 a , 102 t , 102 g , 102 c and 102 b have switching valves 902 a , 902 t , 902 g , 902 c and 902 b , respectively. The flow paths from the five solution tanks 102 are combined into one flow path at a flow path connector 903 and connected to one solution inlet 308 . The pump 901 , and the switching valves 902 a , 902 t , 902 g , 902 c and 902 b are connected to the controller PC 101 and the timing for sending the solutions is controlled automatically. In FIG. 9( b ) , the embodiment is characterized by having a changeover valve 904 . The changeover valve 904 is connected to the controller PC 101 and is controlled automatically in such a way that one of the solutions in the solution tanks 102 a , 102 t , 102 g , 102 c and 102 b is sent to the solution inlet 308 . Because the number of valve is reduced to one, this embodiment has an effect of simplifying the structure.
FIG. 10 shows another embodiment 2 of the flowcell 110 and the solution-sending unit 104 . Because the solutions are sent using a nozzle 720 , the number of the pipes can be reduced, resulting in an effect of simplifying the structure of the flowcell 110 having two or more flow paths. Although an example with three flow paths is shown in FIG. 10 , the number of the flow paths may be two or less, or four or more. The solutions are sent by the following method. It is assumed here that a flow path 311 a is in the observation field of the objective lens 121 . The nozzle 720 accesses one of the solution tanks 102 a , 102 t , 102 g , 102 c and 102 b and a reagent is sucked with a solution-sending unit 719 . The nozzle 720 is moved over the flowcell 110 by a nozzle-moving unit 721 and connected to a solution inlet 308 a to introduce the reagent. The waste fluid pushed out from the flow path 311 a is discharged from a solution outlet 309 a into the waste-fluid tank 102 d . Then, the nozzle 720 leaves the solution inlet 308 a and sends the solutions from the other solution tanks by repeating the solution-sending cycles of accessing/sucking/moving/introducing. When DNA sequencing in the flow path 311 a is finished, the flowcell 110 is moved in the Y-axis direction by a driving unit 712 and a flow path 311 b is moved to the observation field of the objective lens 121 . DNA sequencing is conducted by carrying out a similar solution-sending operation. By repeating this operation with respect to a flow path 311 c , DNA sequencing in the three flow paths can be conducted sequentially. The above operations are controlled automatically by the controller PC 101 . In order to simplify the explanation, the components of the detection unit 120 except for the objective lens 121 are not shown in FIG. 10 . Although one nozzle 720 is used in the above example, the solutions may be sent by two or more nozzles aligned in parallel using two or more solution inlets for each flow path. Because a nozzle can introduce a regent while another nozzle is accessing/sucking/moving, this case has an effect of shortening the time of the solution-sending cycles. Example 2
FIG. 11 shows a structure around the flowcell 110 of Example 2. The other components are the same as in Example 1. Example 2 is characterized in that two or more flow paths are aligned and the flow paths are processed in parallel by synchronizing solution sending and driving of the flowcell 110 . This has an effect of increasing the number of parallel processing.
The flowcell 110 has two or more flow paths 311 . The flowcell 110 is fixed on a driving unit 731 and can move the flow paths to the observation field of the objective lens 121 one after another. Although the solution-sending unit 104 shown in FIG. 9 is connected to each flow path of the flowcell 110 , the solution-sending units 104 are not shown in the figure. In this Example, the embodiment of the flowcell 110 and the solution-sending unit 104 is an embodiment in which two or more structures shown in FIG. 9 are aligned, but the other structures of the flowcell 110 and the solution-sending unit 104 shown in Example 1 can be used. Although 10 flow paths are aligned in parallel in FIG. 11 , the number thereof may be more than 10 or less than 10.
According to the flowchart of parallel processing of an extension reaction cycle with two or more flow paths in FIG. 12 , the controller PC 101 automatically sends the solutions, obtains images and drives the flowcell 110 . Supplemental explanations for this flowchart are as follows: in the step 616 , because the frame showing the maximum value varied with the position of the reaction spot 105 , the time difference was set at three frames and the acquisition of images was stopped after ((frame showing maximum value)+3 frames). This time difference is in proportion to the time required to completely fill the flow path with a solution. The larger the observation field, the larger the number of frames from the frame showing the maximum value to the frame at which the acquisition of the images is stopped. The number of frames can be set at an optional value as long as the likelihood is 1 or more. In the step 617 , t1=0.3 sec and t2=1.0 sec in this Example. t1 is the period from the time showing the maximum value to the completion of the extension reaction. In the example of FIG. 5 , the maximum value was around 90 msec and the extension reaction was completed at around 400 msec, and thus t1=0.3 sec in view of the difference thereof (310 msec). It is appropriate that t2 be longer than the time required to replace the solution in the flow path with the solution in the solution tank 102 b . In this regard, however, it is desirable that the replacement of the solution is completed before the next extension reaction. When the period from the initiation of the solution sending to the time showing the maximum value (this period is referred to as t0) is known in advance, the steps 613 and 614 may be skipped and the solution sending in the step 611 and the acquisition of the images in the step 612 may be conducted for the period t0.
(Other Embodiments of Flowcell)
Embodiments of the flowcell 110 other than the above embodiments are shown. FIG. 13 shows another embodiment 3 of the flowcell 110 . Two flowcells 110 are aligned on a driving unit 741 . The driving unit can be driven in the X and Y directions. By driving the driving unit 741 in order of
to
in FIG. 13 in such an embodiment, an effect of reducing unnecessary driving upon scanning the surfaces of the flowcells 110 is achieved. FIG. 14 is another embodiment 4 of the flowcell 110 . The flowcell 110 has a disk shape with a hollow. The flowcell 110 is fixed on a rotary driving unit 751 . In the hollow of the flowcell 110 , the solution tanks 102 a , 102 t , 102 g , 102 c and 102 b are on the rotary driving unit 751 . By rotating the rotary driving unit 751 , the flow paths 311 can be moved to the observation field of the objective lens 121 one after another. Although the components such as the pipes connecting the solution tanks and the inlets 308 , and the pumps are not shown in the figure, these components are the same as those in FIG. 1 . In FIG. 14 , the waste-fluid tank 102 d is separated from the flowcell 110 in the direction of the outline arrow for the purpose of explanation. A pipe 752 is attached to each of the solution outlets 309 and the waste fluids drip through the pipes to the waste-fluid tank 102 d . The waste-fluid tank 102 d is separate from the rotary driving unit 751 and thus does not rotate. The structure of FIG. 14 also has an effect of reducing unnecessary driving upon scanning the surface of the flowcell 110 . Example 3
FIG. 15( a ) shows a structure around a driving unit 761 and the flowcell 110 of Example 3. The other components are the same as the components in the Examples above. The characteristics of this Example are that the driving unit 761 is driven at the same speed as the speed (flow rate) of the surface of a solution containing bases from the solution tank 102 a , 102 t , 102 g or 102 c moving in the flow path but in the opposite direction, and thus the part near the interface of the solution moving in the flow path is located right under the observation field of the objective lens 121 and two or more fields are detected. This method has an effect of increasing the number of parallel processing. In addition, because two or more fields can be detected in each flow path, this method has an effect of making the amount of the reagent for each field very low.
As the method for obtaining images by the image sensor 134 , a method in which images are obtained successively with a charge-transfer direction and a speed corresponding to those of the driving unit 761 (Time Delay Integration; TDI) is effective. Because the gap between adjacent observation fields can be minimized, this method has an effect of using the area of the flow path 311 effectively. The relation of the observation field and the interface of a solution moving in the flow path above in case of TDI driving is shown in FIG. 15 ( b ) . It is preferable that the solution interface is as close to the edge of the scanning direction side of the observation field as possible. This has an effect of shortening the scanning time. FIG. 16 is a flowchart of a sequencing cycle of TDI driving. It is not always necessary to conduct the step 1603 before the step 1604 . The obtained images may be stored in a recording medium and the step 1603 may be conducted after the extension reaction cycles.
The flowcell 110 may be driven by step driving of each field. This case should follow the flowchart of an extension reaction cycle of step driving in FIG. 17 . In the step 1606 , t1 should be longer than the period from the initiation of the extension reaction in a position in the field where the solution reaches the latest to the time when the maximum pixel value is observed. In this Example, t1=0.4 seconds. t1 is set in accordance with the field size and the speed for sending the solutions.
In the two flowcharts above ( FIGS. 16 and 17 ), the driving unit 761 is driven to move to an observation field 1 simultaneously with the initiation of the introduction of the buffer solution in the solution tank 102 b ( 1604 or 1608 ). This has an effect of shortening the measurement time. In this regard, however, the initiation of the introduction of the buffer solution may be before the completion of the acquisition of the image of the last field. As long as the reaction time sufficient for finishing the extension reaction in all the fields is ensured, it is possible to start introducing the buffer solution at any time. The observation field may be moved by driving the detection unit 120 as well as by moving the flowcell 110 .
(Other Embodiments of Flowcell)
The description continues in the full USPTO document.