Lapsed, fee not paid17 drawings
Cameras, Displays & Optics · US 9,733,609 B2
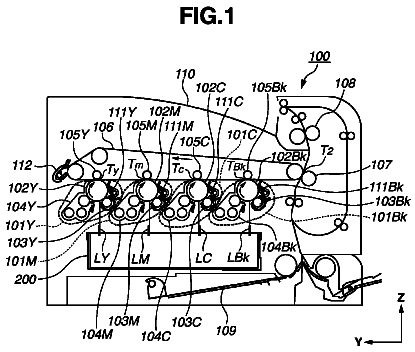
Image forming device provided with first and second discharge rollers
An image forming device includes first and second discharge rollers, and first and second covers.
US 9,734,440 B2 · Assignee: Rampage LLC · Inventors: Bogart; Mitchell J.
Sheet 1 of 62 from the published document. All sheets in the USPTO PDF
System and method of calibration, screening, and compensation for multiple gray-level digital presses. Unequal quantization of the input range is employed with compensated overlapping of sub-ranges. Multiple instances of bi-level screening algorithms, tone modification functions, and a recombination algorithm are employed to produce calibrated screening on individual tone ranges. The method works with any bi-level screening algorithm and devices with any number of gray-levels. Quality imaging results from high detail, high tonal accuracy, low screening noise, and lack of printed artifacts. Dynamic re-calibration is facilitated. The elimination of the constraint of evenly spaced gray-levels has advantages of cost and yield for print head fabricators and digital press manufacturers. Multiple implementations are given for hardware and software embodiments. The present invention, which comprises a print profile for each colorant, is extended to comprise additional print profiles, as needed, specifying the print characteristic of a single or group of aberrant nozzles.
FIG. 1 shows a conventional bi-level digital printing system 100 having a bi-level digital printing machine 102 and a raster image processor 104 widely used by commercial print shops to print high volume and high quality prints from an input file 80 such as a raster file format (tiff, JPEG, etc.) or a vector file format (pdf, Postscript, etc.). Bi-level digital printing machine 102 has a plurality of fixed print heads (not shown) each having a plurality of fixed nozzles (not shown) that can print a single sized dot or no dot as the paper passes under the nozzles. Raster image processor 104 has an interpretation module 106 and a rendering module 108 . As is well known in the art, interpretation module 106 and rendering module 108 have computer instructions or code to produce an unscreened raster image file 110 from input file 80 that is in a non-raster image format (for example, pdf). If
1 of 62 drawing sheets so far from the published document, cropped to the drawing. Every sheet is in the USPTO PDF.
What the patent claimed, word for word. All of it is now free to use.
FIG. 1 shows a conventional bi-level digital printing system 100 having a bi-level digital printing machine 102 and a raster image processor 104 widely used by commercial print shops to print high volume and high quality prints from an input file 80 such as a raster file format (tiff, JPEG, etc.) or a vector file format (pdf, Postscript, etc.). Bi-level digital printing machine 102 has a plurality of fixed print heads (not shown) each having a plurality of fixed nozzles (not shown) that can print a single sized dot or no dot as the paper passes under the nozzles. Raster image processor 104 has an interpretation module 106 and a rendering module 108 . As is well known in the art, interpretation module 106 and rendering module 108 have computer instructions or code to produce an unscreened raster image file 110 from input file 80 that is in a non-raster image format (for example, pdf). If input file 80 is a raster file, then input file 80 requires only raster processes, such as scaling and color conversion, to produce unscreened raster image file 110 . Examples of conventional bi-level digital printing systems having a digital printing machine and a raster image processor are the HP® Indigo® 20000 digital press sold by Hewlett-Packard Company (www8.hp.com/us/en/commercial-printers/indigo-presses/20000.htm); the KODAK NEXPRESS SX2700 digital press sold by Ricoh Corporation (http://rpp.ricoh-usa.com/products/production-printers/cutsheet/kodak-nexpress); and the Xerox® Color J75 digital press sold by Xerox Corporation www.xerox.com/digital-printing/printers/digital-press/xerox-j75/enus.html).
FIG. 2 shows a generic unscreened raster image file 110 produced by rendering module 108 (w pixels wide by h lines high). Each pixel of unscreened raster image file 110 has a continuous tone value (for example, 0-1023 for 10 bit tone values) for each colorant of Cyan, Magenta, Yellow and black (CMYK). In order to print unscreened raster image file 110 on bi-level digital printing machine 102 , raster image processor 104 further comprises a screening module 114 ( FIG. 1 ) that has computer instructions to screen or convert the continuous tone value of each pixel of unscreened raster image file 110 to a print level value (0 or 1) stored in an output bitmap file 116 ( FIG. 1 ) using a well known half-toning algorithm such as threshold screening or AM screening.
FIG. 3 shows a high level flow chart of conventional screening module 114 of raster image processor 104 . For each pixel on each line of an input unscreened raster file 110 , whose coordinates are X and Y, the continuous tone value is processed into a 1-bit output value by a half-toning algorithm.
Multi level printing machines are being developed where a nozzle can print more than two
levels for each printed pixel, such as a four level machine. For example, in a four level machine, each nozzle can print no dot, a small dot, a medium dot or a large dot thereby allowing for a much finer quality print. FIG. 4 shows a generic screened 2-bit output bitmap file for a 4-level digital printing machine. Each pixel has a value of 0-3, with a set of raster data for each printing ink or colorant.
FIG. 5 shows a conventional way of partitioning the tone ranges in equal parts for a 4-level press having 3 dot sizes. One disadvantage of such contiguous sectioning of the printed tone range into equal parts, one for each output tone level for each colorant, is an artifact of flattening or visible loss of screening at the boundaries between the levels.
FIG. 6 is a graph illustrating a response that one would expect for a perfectly built and correctly operating or ideal digital printing machine. For such an ideal press, an input tone value of 33.3% from the unscreened raster file results in a patch of small size dots having a measured print strength of 33.3 percent. However, no digital printing machine operates in an ideal manner.
FIG. 7 is a graph illustrating a response for a digital printing machine that behaves in a non-ideal manner. In this example, an input tone value of 33.3% from the unscreened raster file results in a patch of small size dots having a measured print strength of 45 percent and not 33.3 percent. Further, an input tone value of 66.7 percent results in a patch of all medium size dots having a measured print strength of 55 percent and not 66.7 percent. As such, unwanted artifacts in the print are created as a result of the print heads of the digital printing machine producing a stronger or lighter intensity level for any continuous tone value of the unscreened raster file. These improper values and the intermediate values need to be carefully compensated.
Another drawback with conventional screening modules is the inability to compensate for variations in print strength of individual inkjet nozzles except by modifying the continuous tone input data. Aside from the difficulty in precisely specifying such corrections, for large compensations this can reduce the number of available printed screened tone levels, resulting in undesirable tone banding artifacts. This invention allows for an additional form of compensation that does not reduce the number of printed tone levels, while also simplifying the specification of the individual compensations.
One object of the present invention is to provide a raster image processor and method thereof that produces a high quality multi-level screened output bit map file for digital printing machines that easily, accurately, and precisely removes the flattened tone contour artifacts.
Another object of the present invention is to provide a raster image processor and method thereof that removes unwanted artifacts in the print created as a result of the print heads of the digital printing machine producing a stronger or lighter intensity levels.
Another object of the present invention is to provide a raster image processor and method thereof that produces a high quality multi-level screened output bit map file for digital printing machines that employs any bi-level half-toning algorithm.
Another object of the present invention is to provide a raster image processor and method thereof that produces a high quality multi-level screened output bit map file for digital printing machines with an arbitrary number of gray levels, not limited to a power of 2.
Another object of the present invention is to provide a raster image processor and method thereof that produces a high quality multi-level screened output bit map file for digital printing machines whose multiple gray levels are extremely far from being equally spaced in the tone range, thus giving expanded design leeway to designers of new digital printing machines.
Another object of the present invention is to provide a raster image processor and method thereof that produces a high quality multi-level screened output bit map file for digital printing machines with a calibration method and system that is straightforward, accurate, powerful, and quick, enabling rapid adaptation to changing print conditions, print heads, nozzles, electronics, and other physical varying factors.
Another object of the present invention is to provide a method of compensation of variations of individual print positions or nozzles, that does not reduce the number of printed tone levels, while also simplifying the specification of the individual compensations.
In one embodiment, the present invention is a system and method of calibration, screening, and compensation for multiple gray-level digital presses. Unequal quantization of the input range is employed with compensated overlapping of sub-ranges. Multiple instances of bi-level screening algorithms, tone modification functions, and a recombination algorithm are employed to produce calibrated screening on individual tone ranges. The method works with any bi-level screening algorithm and devices with any number of gray-levels. Quality imaging results from high detail, high tonal accuracy, low screening noise, and lack of printed artifacts. Dynamic re-calibration is facilitated. The elimination of the constraint of evenly spaced gray-levels also has advantages of cost and yield for both print head fabricators as well as digital press manufacturers. Multiple implementations of the system and method are given for both hardware and software embodiments of the invention. The present invention, which comprises a print profile for each colorant, is extended to further comprise additional print profiles, as needed, specifying the print characteristic of a single or group of aberrant nozzles. The present invention, which comprises a print profile for each colorant, is extended to further comprise additional print profiles, as needed, specifying the print characteristic of a single or group of aberrant nozzles.
The following description of the invention will be further understood with reference to the accompanying drawings, in which:
FIG. 1 is a high level block diagram showing the architecture of a conventional raster image processor used to produce a conventional output bit map file for a bi-level digital printing machine.
FIG. 2 illustrates a conventional raster image file produced by a conventional rendering modules having a plurality of printable positions of a page defined by pixel location, line number, and CMYK value.
FIG. 3 shows a high level flow chart of a conventional screening module of a rip. For each pixel on each line of an input unscreened raster file, whose coordinates are X and Y, the continuous tone value is processed into a 1-bit output value via a half-toning algorithm.
FIG. 4 illustrates a conventional screened bit map output file stored in a bitmap memory device for each of the colorants Cyan, Magenta, Yellow, and Black for printable positions of a page defined by pixel location and line number. Each of the printable positions of the bit map has a 4-level output value (0-3) indicative of no dot, a small dot, a medium dot, and a large dot.
FIG. 5 illustrates a conventional full tone range for a first colorant having three equal tonal sub-ranges corresponding to small, medium, and large size dots, respectively.
FIG. 6 is a graph illustrating a response that one would expect for a perfectly built and correctly operating or ideal digital printing machine.
FIG. 7 is a graph illustrating a response for a digital printing machine that behaves in a non-ideal manner.
FIG. 8 is a high level block diagram showing the architecture of a raster image processor according to the present invention used to produce a bit map output file for a digital printing machine capable of printing multiple levels such as a no dot level, a small dot level, a medium dot level, and a large dot level.
FIG. 9 is a high level block diagram showing the Screening Module according to the present invention comprising a Calibration Module and a Pixel Processing Module comprising a Tone Sub-range sub-module, a Boundary Shifting sub-module, an Overlap sub-module, a Tone Modification sub-module, and an Output sub-module.
FIG. 10 is a high level flow chart showing the operation of the Screening Module according to the present invention.
FIG. 11 is a high level flow chart showing the operation of the pixel processing module of the screening module according to the present invention.
FIG. 12 is a high level flow chart showing the operation of the calibration module of the screening module.
FIG. 13 is a high level flow chart showing an example of the process of the Calibration Sub-module.
FIG. 14 illustrates a test pattern of the calibration module.
FIG. 15 illustrates a digital press profile according to the present invention.
FIG. 16 illustrates a full tone range for a first colorant comprising three tonal sub-ranges corresponding to a first printable tone level (for example, a small size dot), a second printable tone level (for example, a medium size dot), and a third printable tone level (for example, a large size dot), respectively, with the tonal sub-ranges shifted.
FIG. 17A illustrates a tone modification function for a first printable tone level (for example, a small size dot) after transition point shifting according to the present invention.
FIG. 17B illustrates a tone modification function for a second printable tone level (for example, a medium size dot) after transition point shifting according to the present invention.
FIG. 17C illustrates a tone modification function for a third printable tone level (for example, a large size dot) after transition point shifting according to the present invention.
FIG. 18 is a high level flow chart showing the process of raster image processor according to the present invention.
FIG. 19 is a flow chart showing the operation of the Screening Module according to the present invention using example measurements.
FIG. 20 is a flow chart showing the process of the tone modification sub-module of the pixel processing module.
FIG. 21 is a flow chart showing an example of the process of the tone modification sub-module with example calculations.
FIG. 22 illustrates solid patches of large dots which may be purposely oversized to enable solid coverage and may require additional linearization using conventional dot gain compensation methods.
FIG. 23 illustrates a non-linear dot area response curve and its inverse function for input compensation.
FIG. 24 is a flow chart showing the operation of the pixel processing module.
FIG. 25 is a flow chart of example pseudo code showing the operation of the pixel processing module.
FIG. 26 is a high level schematic of the pixel processing module of the screening module shown in a hardware implementation for discrete logic, ASIC chips, FPGAs, etc, with threshold matrix or supercell type of screening.
FIG. 27 is a high level schematic of the output sub-module of the screening module according to the present invention shown in a hardware implementation for discrete logic, ASIC chips, FPGAs, etc, where each output tone value is assigned a level of 0, 1, 2, or 3 corresponding to no dot, small dot, medium dot, and large dot, respectively.
FIG. 28 is a high level schematic of the pixel processing module of the screening module shown in a hardware implementation for discrete logic, ASIC chips, FPGAs, etc, for an error diffusion type of screening.
FIG. 29 is a high level schematic of one implementation of a tone modification function in hardware suitable for discrete logic, ASIC chips, FPGAs, etc.
FIG. 30 is a block diagram illustrating an alternate implementation of a tone modification function employing a look-up table in memory, suitable for a hardware or a software implantation, comprising pre-computed tone modification values for a single printable tone level (for example, a small size dot, a medium size dot, or a large size dot).
FIG. 31 is a high level flow chart showing the operation of a first embodiment of the overlap module with simple overlap.
FIG. 32 is a graph showing a full tone range for a first colorant comprising three equally spaced tonal sub-ranges corresponding to a small dot size level, a medium dot size level, and a large dot size level, respectively, with the second tonal sub-range overlapping the first tonal sub-range and the third tonal sub-range overlapping the second tonal sub-range.
FIG. 33 illustrates a full tone range for a first colorant comprising three tonal sub-ranges corresponding to a first printable tone level (for example, a small size dot), a second printable tone level (for example, a medium size dot), and a third printable tone level (for example, a large size dot), respectively, with shifting and simple overlapping of the tonal sub-ranges.
FIG. 34A is a graph of a tone modification function for the first printable tone level (for example, a small size dot) of a first colorant (for example, Cyan) with shifting and simple overlapping;
FIG. 34B is a graph of a tone modification function for the second printable tone level (for example, a medium size dot) of a first colorant (for example, Cyan) with shifting and simple overlapping.
FIG. 34C is a graph of a tone modification function for the third printable tone level (for example, a large size dot) of a first colorant (for example, Cyan) with shifting and simple overlapping.
FIG. 35 is a high level flow chart showing the process of a second embodiment of the overlap module with shifting and bi-directional overlapping.
FIG. 36 is a graph showing a full tone range for a first colorant (for example, Cyan) comprising three equally spaced tonal sub-ranges corresponding to a first printable tone level (for example, a small dot size), a second printable tone level (for example, a medium dot size), and third printable tone level (for example, a large dot size), respectively, with the second tonal sub-range bi-directionally overlapping the first tonal sub-range and the third tonal sub-range bi-directionally overlapping the second tonal sub-range.
FIG. 37A is a graph of a tone modification function for the first printable tone level (for example, a small size dot) with shifting and bi-directional overlapping.
FIG. 37B is a graph of a tone modification function for the second printable tone level (for example, a medium size dot) with shifting and bi-directional overlapping.
FIG. 37C is a graph of a tone modification function for the third printable tone level (for example, a large size dot) with shifting and bi-directional overlapping.
FIG. 38 is an example of calibration and screening parameter calculations for a single colorant.
FIG. 39 is a rendered unscreened image of a test picture in CMYK.
FIG. 40 is an image of the Cyan separation of the test picture of FIG. 39 .
FIG. 41 is an image of the Magenta separation of the test picture of FIG. 39 .
FIG. 42 is an image of the Yellow separation of the test picture of FIG. 39 .
FIG. 43 is an image of the Black separation of the test picture of FIG. 39 .
FIG. 44 is an image of the test picture for the separation Cyan ( FIG. 40 ) after processing by the small level tone modification function.
FIG. 45 is an image of the test picture for the separation Cyan ( FIG. 40 ) after processing by the medium level tone modification function.
FIG. 46 is an image of the test picture for the separation Cyan ( FIG. 40 ) after processing by the large level tone modification function.
FIG. 47 is an image of the test picture for the tone modified Cyan separation ( FIG. 44 ) after processing by a 1-bit half-toning algorithm.
FIG. 48 is an image of the test picture for the tone modified Cyan separation ( FIG. 45 ) after processing by a 1-bit half-toning algorithm.
FIG. 49 is an image of the test picture for the tone modified Cyan separation ( FIG. 46 ) after processing by a 1-bit half-toning algorithm.
FIG. 50 is an image for the separation Cyan after combining the half-toned images of the separation Cyan of the small dots ( FIG. 47 ), medium dots ( FIG. 48 ), and large dots ( FIG. 49 ).
FIG. 51 is an image for the separation Magenta after combining the half-toned images of the separation Magenta of the small dots, medium dots, and large dots.
FIG. 52 is an image for the separation Yellow after combining the half-toned images of the separation Yellow of the small dots, medium dots, and large dots.
FIG. 53 is an image for the separation Black after combining the half-toned images of the separation Black of the small dots, medium dots, and large dots.
FIG. 54 is a single CMYK composite image composed of the four combined output images of FIGS. 50-53 .
FIG. 55 is an extremely high level zoom of a small portion of the single CMYK composite image of FIG. 54 based upon calibrated tonal range output levels of 0%, 45%, 75%, and 100%.
FIG. 56 shows the black separation of the CMYK image of FIG. 55 .
FIG. 57 is an extremely high level zoom of a small portion of a single CMYK composite image after calibration and compensation after a drastic change of the printing levels (for whatever reason) to 0%, 25%, 50%, and 100%.
FIG. 58 shows the black separation of the CMYK image of FIG. 57 .
FIG. 59A is a digital press profile for a normal nozzle or group of nozzles.
FIG. 59B is a digital press profile for an aberrant nozzle or group of aberrant nozzles.
FIG. 60A illustrates a full tone range for a first colorant from a normal nozzle comprising three tonal sub-ranges corresponding to a first printable tone level (for example, a small size dot), a second printable tone level (for example, a medium size dot), and a third printable tone level (for example, a large size dot), respectively.
FIG. 60B illustrates a full tone range for a first colorant from an aberrant normal nozzle comprising three tonal sub-ranges corresponding to a first printable tone level (for example, a small size dot), a second printable tone level (for example, a medium size dot), and a third printable tone level (for example, a large size dot), respectively.
FIG. 61A shows the tone modification function for the first printable tone level for a normal nozzle or group of nozzles.
FIG. 61B shows the tone modification function for the second printable tone level for a normal nozzle or group of nozzles.
FIG. 61C shows the tone modification function for the third printable tone level for a normal nozzle or group of nozzles.
FIG. 62A shows the tone modification functions for the first printable tone level for an aberrant nozzle or group of nozzles.
FIG. 62B shows the tone modification function for the second printable tone level for an aberrant nozzle or group of nozzles.
FIG. 62C shows the tone modification function for the third printable tone level for an aberrant nozzle or group of nozzles.
FIG. 63A shows a print simulation of a test image containing photos and process color ramps for the case when all nozzles are pristine or functioning normally.
FIG. 63B shows a print simulation of the test image for the case when there are aberrant nozzles.
FIG. 64A shows a print simulation of the test image for the case when all nozzles are pristine but the compensation of the invention is in effect nevertheless.
FIG. 64B shows a print simulation of the test image for the case when there are aberrant nozzles and the compensation of the invention is in effect.
FIG. 65A shows a closeup of FIG. 63A (Pristine) for all separations.
FIG. 65B shows a closeup of FIG. 63A (Pristine) for just the Magenta separation.
FIG. 66A shows a closeup of FIG. 63B (Aberrant nozzles) for all separations.
FIG. 66B shows a closeup of FIG. 63B (Aberrant nozzles) for just the Magenta separation.
FIG. 67A shows a closeup of FIG. 64A (just Compensation) for all separations.
FIG. 67B shows a closeup of FIG. 64A (just Compensation) for just the Magenta separation.
FIG. 68A shows a closeup of FIG. 64B (Aberrant with Compensation) for all separations.
FIG. 68B shows a closeup of FIG. 64B (Aberrant with Compensation) for just the Magenta separation.
FIG. 69 shows an extreme closeup of FIG. 68B (Aberrant with Compensation for just the Magenta separation) with the image horizontally centered on the left-right transition from normal to aberrant nozzles.
Referring to FIG. 8 , a system 801 according to the present invention comprises a raster image processor 800 connected with a multi level digital printing machine 850 . In the embodiment shown, digital printing machine 850 is a four
printable level machine having at least one grayscale or multi-level print head 856 . In other embodiments, digital printing machine 850 may be more or less than a four
printable level machine. Raster image processor 800 generally comprises a computing device 802 , a memory device 804 connected with computing device 802 , an interpretation module 806 stored on memory device 804 , a rendering module 808 stored on memory device 804 adapted to produce an unscreened raster image file 810 , and a screening module 812 adapted to produce a screened output bit map 814 . Computing device 802 may be one or more of any type of presently known or futurely developed computational processing device, including but not limited, to central processing units, microprocessors, and graphic processing units. Memory device 804 may be any type of memory device capable of storing computer instructions or code. Interpretation module 806 comprises a set of well known computer instructions or code stored on memory device 804 to interpret input file 80 describing the page (not shown) to be printed. Rendering module 808 comprises a set of well known computer instructions or code stored on memory device 804 to produce unscreened raster image file 810 specifying a continuous tone value for a first, second, third, and fourth colorant (CMYK) value in the range of 0-1023 (in the case of a 10 bit tone) for each printable position on the page (not shown). As will be described herein, screening module 812 comprises a plurality of instructions to convert each of the continuous tone values to a four
level output bit map 814 , namely, a tone value of 0, 1, 2 or 3 in a manner that significantly reduces contour artifacts and is easily, accurately, and precisely compensated. The term “module” means computer instructions or code that may be implemented in software or hardware. Such computer instructions or code may be programmed in any presently or futurely developed programming language such as C or C++for most types of computing devices and CUDA® for NVIDIA® graphic processing units. As will be described more fully herein, screening module 812 may be implemented as software stored on memory device 804 or discrete circuit hardware directly connected with computing device 802 and/or digital printing machine 850 .
Referring to FIG. 9 , screening module 812 generally comprises a calibration module 902 , a tone sub-range module 906 , a boundary shifting module 908 , and a pixel processing module 904 comprising a tone modification sub-module 912 , an inverse compensation sub-module 914 , and an output sub-module 916 . In another embodiment of the invention, screening module 812 may further comprise an overlap module 910 .
Referring to FIG. 10 , a high level flow chart shows the process of screening module 812 for digital printing machine 850 ( FIG. 8 ). In this example, input file 810 from rendering module 808 may be either a composite file containing all colorants or separate files one for each colorant. As indicated by step 1002 , screening module 812 initializes variables X and Y to zero. As indicated by step 1004 , screening module 812 is configured to obtain the continuous tone value 1010 for the current X-Y position 1006 . As indicated by step 1008 , continuous tone value 1010 is processed by pixel processing module 1008 to produced a multi bit output value 1012 for X-Y position 1006 . For example, a value of 575 from a 10 bit continuous tone range of input file 810 from rendering module 808 at X-Y position 1006 is processed by pixel processing module 904 to generate a two bit output 1012 of values 0, 1, 2 or 3. As indicated by step 1014 , position X is incremented to point to the next pixel to the right. As indicated by step 1016 , screening module 812 determines if the rightmost limit of X exceeds the raster width. If not, control is returned where the next X-Y position is processed by pixel processing module 904 to produce the next two bit output 1012 . If the rightmost limit of X exceeds the raster width then, as indicated by step 1018 , screening module 812 sets the position of X to the left beginning of the next line Y. As indicated by step 1020 , screening module 812 is configured to determine if the last line Y has been processed and if so, ends execution of the module. If not, control is returned where the next X-Y position is processed by pixel processing module 904 to produce the next two bit output 1012 .
Referring to FIG. 11 , where a high level flow chart shows the operation of pixel processing module 904 according to the present invention for a four-level digital printing machine 850 . As indicated by a block 1102 , a current X and Y printable position is input to each of bi-level half-toning algorithms 1110 , 1112 , and 1114 of output sub-module 916 . The continuous tone value corresponding to the current X and Y position from input file 1010 , for each of the four
colorants, is the input value to each of first, second, and third tone modification functions 1104 , 1106 , and 1108 of tone modification sub-module 912 . The output from first, second, and third tone modification functions 1104 , 1106 , and 1108 are then each passed through an inverse compensation function appropriate for that colorant and dot size from the Inverse Compensation module 914 . The outputs of the compensation functions are the inputs to bi-level half-toning algorithms 1110 , 1112 , and 1114 , respectively, that generate three one bit output values 1116 , 1118 , and 1120 , each having a value of 0 or 1. As indicated by block 1122 , these three one bit output values are combined by Boolean logic to produce a single 2-bit output value 1012 (0, 1, 2 or 3) that is stored in output bit map 814 ( FIG. 8 ).
Referring to FIG. 12 , a high level flow chart shows the process of calibration module 902 . Calibration module 902 comprises a set of instructions 1202 to create a test pattern for each colorant comprising a first test patch having only a first printable tone level (for example, only small size dots), a second test patch having only a second printable tone level (for example, only medium size dots), and a third test patch having only a third printable tone level (for example, only large size dots). Calibration module 902 further comprises a set of instructions 1204 to print the test patterns for each colorant. Calibration module 902 further comprises a set of instructions 1206 to measure the optical strength of each of the first, second, and third test patches of each colorant of test pattern 1402 using optical density as the measurement and to store these values in digital press profile 852 ( FIGS. 8 and 15 ) for use as needed. Calibration module 902 further comprises a set of instructions 1208 to convert the measurements of each of the first, second, and third test patches to an equivalent dot area value using a well known Murray-Davies equation (www.xrite.com/documents/apps/public/whitepapers/Ga00005a.pdf) that converts from optical density to percentage dot area as follows:
percentage dot area ( 0 - 100 % ) = 1 - 10 .Math. ( - Dtone ) 1 - 10 .Math. ( - D max ) × 100 where Dmax represents the measured maximum optical density, and Dtone represents the measured density of a patch for which to produce the percentage dot area.
Example densities: 0.0 0.479 1.08 2.5---->0 67% 92% 100%
Example2 densities 0.0 0.1752 0.4735 2.5---->0 33% 67% 100%
Referring to FIGS. 13 and 14 , where an example is given for the process of calibration module 902 . As indicated by block 1302 , calibration module 902 comprises a set of instructions to create a test pattern having twelve test patches as shown in FIG. 14 (3 printable levels or dot sizes each, for each of the four colorants, CMYK). The three
dot sizes may be small, medium, and large dots or other dot sizes. Calibration module 902 further comprises a set of instructions 1304 to print the test pattern. Calibration module 902 further comprises a set of instructions 1306 to measure the optical strength of each of the twelve test patches using optical density as the measurement. In the example shown, for the colorant Cyan, the measured density is 0.475 for the first printable tone level of digital printing machine 850 (for example, small size dots); 1.08 for the second printable tone level of digital printing machine 850 (for example, medium size dots), and 2.5 for the third printable tone level of digital printing machine 850 (for example, large size dots). Also shown are optical densities values for the colorants Magenta, Yellow, and Black. The optical density for each of the first, second, and third test patches of each colorant is converted to an equivalent dot area using the Murray-Davies equation. In the example shown, Cyan has an equivalent dot area of 67% for the first printable tone level (for example small size dots), 92% for the second printable tone level (for example, medium size dots), and 100% for the third printable tone level (for example, large size dots). The optical density is measured using a well known densitometer such as the X-Rite eXact available from X-Rite, Inc., 4300 44th St. SE, Grand Rapids, Mich. 49512 U.S.A. (www.xrite.com), or a similar device, that may be part of digital printing machine 850 or a separate machine connected with raster processor 800 and digital printing machine 850 .
Referring to FIG. 15 , where digital press profile 852 ( FIG. 8 ) is further illustrated. Data stored in Digital Press Profile 1502 includes maximum measured densities for all colorants and dot sizes. It also includes curve data points when they are used.
Referring to FIG. 16 , tone sub-range module 906 ( FIG. 9 ) comprises a first set of computer instructions configured to create and store a first tonal sub-range 1602 corresponding substantially to increasing percentages of the first printable tone level of digital printing machine 850 for each of the four colorants. Tone sub-range module 906 further comprises a second set of computer instructions to create and store a second tonal sub-range 1610 corresponding substantially to increasing percentages of the second printable tone level of digital printing machine 850 for each of the four colorants. Tone sub-range module 906 further comprises a third set of computer instructions to create and store a third tonal sub-range 1620 corresponding substantially to increasing percentages of the third printable tone level of digital printing machine 850 for each of the four colorants. The sub-ranges may and probably will be different for each of the colorants. First tonal sub-range 1602 comprises a beginning boundary tone value 1604 and an ending boundary tone value 1606 defining a first tone range span 1608 . Second tonal sub-range 1610 comprises a beginning boundary tone value 1612 and an ending boundary tone value 1614 defining a second tone range span 1616 and a first transition tone value 1618 to be the value of both ending boundary tone value 1606 of first tonal sub-range 1602 and beginning boundary tone value 1612 of second tonal sub-range 1610 . Third tonal sub-range 1620 comprises a beginning boundary tone value 1622 and an ending boundary tone value 1624 defining a third tone range span 1626 and a second transition tone value 1628 to be the value of both ending boundary tone value 1614 of second tonal sub-range 1610 and beginning boundary tone value 1622 of third tonal sub-range 1620 .
With continued reference to FIG. 16 , boundary shifting module 908 generally comprises a set of instructions to shift the positions of first and/or second transition tone values 1618 and 1628 depending upon the calibration data of digital printing machine 850 from calibration module 902 stored in digital press profile 852 . For example, boundary shifting module 908 may comprise a set of instructions that shift the position of first transition tone value 1618 so that, for example, first tone range span 1608 (size of first tonal sub-range 1602 ) is different from second tone range span 1616 (size of second tonal sub-range 1610 ). By way of further example, boundary shifting module 908 may comprise a set of instructions that shift the position of second transition tone value 1628 so that second tone range span 1616 (size of second tonal sub-range 1610 ) is different from third tone range span 1626 (size of third tonal sub-range 1620 ). Boundary shifting module 908 further comprises a set of instructions to set the first transition tone value 1618 , for a given colorant, using the measured density of the patch of small size dots for the colorant and the highest measured optical density of the test patch of large size dots for the colorant as the Dmax value used in the Murray-Davies equation. Boundary shifting module 908 further comprises a set of instructions to set the second transition tone value 1628 , for a given colorant, using the measured density of the patch of medium size dots for the colorant and the highest measured optical density of the test patch of large size dots for the colorant as the Dmax value used in the Murray-Davies equation.
Referring to FIGS. 17A-17C , where the process of tone modification sub-module 912 and tone modifications 1104 , 1106 and 1108 ( FIG. 11 ) is illustrated for an example where first and second transition tone values 1618 and 1628 ( FIG. 16 ) are set to 48% and 70%, respectively, by boundary shifting module 908 . As shown by FIG. 17A , tone modification sub-module 912 comprises a set of instructions to create or produce first tone modification function 1104 for the first printable tone level that is used for each colorant (CMYK). For example, an input tone value of 24% would be modified to a continuous tone value of 50% and an input tone value of 48% or higher would be modified to a value of 100%. As shown by FIG. 17B , tone modification sub-module 912 further comprises a set of instructions to create or produce a second tone modification function 1106 for a second printable tone level that is used for each colorant (CMYK). For example, an input tone value of 48% or less would be modified to a value of 0%, input tone values of 70% or higher would be modified to values of 100% and input values between 48% and 70% would be modified to values between 0% and 100%. As shown by FIG. 17C , tone modification sub-module 912 comprises a set of instructions to produce a third tone modification function 1108 for a third printable tone level that is used for each colorant (CMYK). For example, an input tone value of 70% or lower would be modified to a continuous tone value of 0% and an input tone value of greater than 70% would be modified to values between 0% and 100%.
Referring to FIG. 18 , where a high level flow chart shows a method of screening module 812 . As indicated by block 1802 , tone sub-range module 906 comprises a step of producing for each colorant, first, second, and third tonal sub-ranges corresponding to the first, second, and third printable tone levels, respectively, having first and second transition tone values. As indicated by block 1804 , boundary shifting module 908 comprises a step of shifting the position of first transition tone value 1618 and second transition tone value 1628 so that the first tone range span is different from the second tone range span, and to set first and second transition tone values 1618 and 1628 , for each colorant, by using the highest measured optical density of the test patches of test pattern 1402 ( FIG. 14 ) of digital printing machine 850 ( FIG. 8 ) for the Dmax value used in the Murray-Davies Equation. As indicated by block 1806 , tone modification sub-module 912 comprises a step of producing first, second, and third tone modification functions for the first, second, and third tonal sub-ranges, respectively. As indicated by block 1808 , output sub-module 916 comprises a step of producing a single multi-bit output value corresponding to each colorant for each printable position on the page by using the modified tone value of the first, second, and third tone modification functions as the inputs to a bi-level half-toning algorithm.
The description continues in the full USPTO document.
About 6,661 words. The USPTO PDF has it with every drawing.
Fees are due 3.5, 7.5 and 11.5 years after grant. This patent expired on August 15, 2025, so the fee marked "not paid" was the one that went unpaid.
Raster Image Processor With Printhead Profile Compensation for a Multi Level Digital Printing Machine
Filed Apr 2015 · published May 2016Raster Image Processor With Printhead Profile Compensation for a Multi Level Digital Printing Machine
Filed Apr 2015 · published Jun 2017Raster image processor with printhead profile compensation for a multi level digital printing machine
Filed Apr 2015 · granted Aug 2017Earlier publications, parents and continuations. None of them can still be enforced, or this patent would not be listed.
Prior art cited by the examiner or applicant. Useful when you check your own idea for novelty.
Everything on this page comes from the documents linked above.