Related application data
This application claims priority to the patent application filed in India on Feb. 24, 2005 and having Indian application number 169/CHE/2005.
Field of the invention
The invention relates to the field of Business Rules, and more specifically, to the area of analyzing business policies encoded as business rules.
Background of the invention
General Discussion
Effective business policies are critical for the success of any organization. This observation is almost as old as the term business itself. Having outdated policies can render a firm or organization out of competition in the current market. The strong correlation between success and effective business policies drives each and every business organization to keep their policies current and in sync with the operating business environments of the organization. In addition to keeping the existing policies current is the need to design new policies. With improving economic conditions, and increasing cost of manual labor, almost all enterprises try to automate the process of deploying, monitoring, and revising policies. The rapid growth of information technology has provided the choice of using software programs for such automations. Today, any policy can be encoded as a software program which in an automated setup, processes new events that were previously manually processed. Some of the advantages of using software encodings of the policies include elimination of human errors, higher efficiency of the process, and lesser cost. While this approach of using software programs encoding the policies is probably as good as any other solution as long as the policy is static (that is, it does not change once it has been established), its advantages are seriously challenged and undermined by today's dynamic business environment. In simple terms, when policies change, the software programs encoding such policies need to be modified accordingly. Such modifications will of course entail all of the delays and processes involved in the typical software development cycle. Thus, using software programs poses several inherent disadvantages, including the significant amount of time it takes for even a minor change in the policy to be implemented, and the significant resources required to effect such an implementation. The frequently changing policies and the challenges arising in managing the changes have fueled the growth of the business rules domain.
Among the several solutions that are offered by the business rules domain, we will concentrate only on those that deal with efficiently managing the changes in the policies. The central idea of these solutions is the concept of a business rule. A business rule essentially captures the logical formulation of some aspect of an organization's business. Stated below is OMG's (Object Management Group, www.omg.org) definition of a business rule.
"The essence of a business rule is to express a crisp logical definition of some facet of the organization's way of doing business. It is a statement that defines or constrains some aspect of the business. This must be either a term or a fact, a constraint, or a derivation. It is atomic in that it cannot be broken down or decomposed further into more detailed business rules, without sacrificing important information."
The current solutions offered in the business rules domain include extracting the critical rules from the policies and treating them separately and differently from other parts of the business policy. An underlying hypothesis in connection with this is that when a policy changes, it is the rules part of the policy that changes, rather than the overall structure. Thus, implementing such changes involves only changing the rules, and the other parts need not be modified or adjusted.
Consider the following simple example where the solutions available currently in the business rules domain can be applied. A property mortgage company, say Fictitious Mortgaging Corp. grants loans against mortgaged property using among several other things, the details about applicant's income, her/his credit rating, the type of the property, etc. Below is a simplistic policy followed by the organization to decide whether a loan application for a specific type of loan should be approved or not.
1. If applicant's annual income<minimum annual income limit
Then Reject loan application.
2. If applicant's credit score<minimum credit score limit
Then Reject loan application.
3. If number of bankruptcies in applicant's credit report>0
Then Reject loan application.
4. If none of the above conditions hold
Then Approve loan application.
The policies followed by an actual mortgaging company would be much more complex than the one above. Also, an actual policy would probably contain specific values for the business terms, specifying for example ranges for minimum annual income limit and minimum credit score limit. However, this simplistic example helps us to consider and specify the underlying challenges of modifying and analyzing business rules without getting into unnecessary details.
To begin with, notice that although an actual policy may be worded differently, in most of the cases, it can be re-written as a set of If-Then clauses on business terms somewhat similar to the ones above. This situation is an apt case for the use of a business rules engine, which essentially simplifies the task of maintaining and deploying such business policies, and applying them for processing events such as a new loan application. The use of business rules engines is quite common today, to the extent that a policy is frequently referred to as a ruleset, which is generally considered to simply be a set of rules encoding the policy. As mentioned earlier, the traditional solutions of using software programs for automating policies are not suitable for today's dynamic environment. On the other hand, encoding them as rules and maintaining them separately makes such things easier. That is to say, using a business rules engine to manage policies makes it easier to manage the changes in the policies as and when they happen. Further details about the advantages of business rules engine are beyond the scope of our discussion.
The policy designers, who decide on the precise contents of the policies, and specific details, such as the values for minimum annual income limit and minimum credit score limit often use intuition, personal insights, and statistical reports, which may be generated using some data analysis tools, on the data about loan applications from the past. During the policy's design phase, the policy makers are often faced with questions about what would the optimal value be for a particular parameter (business term) in the policy. For example, how does one decide upon the right values for the business terms minimum annual income limit and minimum credit score limit? As of today, the policy makers need to rely on a static analysis of data (e.g. online analytical processing or fast analysis of shared multidimensional information, predictive data mining, etc.) which possibly has no relation to the intended purpose of the data analysis reports.
For example, a policymaker would probably be very interested in studying how an organization's business targets would be affected, if the policymaker chooses a minimum credit score limit of 620 instead of 580. Such decisions based on static data analysis typically demand that the entire data analysis be redone. Many automated analysis tools and techniques are available today for analyzing static data. Data mining tools are used heavily for studying the trends in the historical data, and using that information to predict the future trends. However, analyzing business rules needs the data to be analyzed in conjunction with the rules themselves, and the data analysis which does not include the information about the rules may not present the right picture.
b. An Abstract Procedure for Policy Design and Analysis
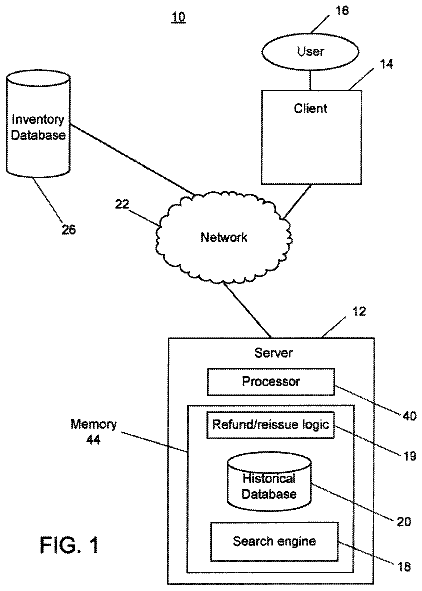
FIG. 1 depicts a traditional method of policy design and analysis. Below is a detailed discussion about the steps involved in such processes.
1. Design a preliminary version of the policy. This is the starting point of the process. The preliminary version may be the current version of the policy, or a completely new one designed from scratch.
2. Gather data analysis reports. This part of the process deals with performing static data analysis on the historical data maintained by the organization. Some relevant details regarding the policy may be included in the data analysis specifications.
3. Generation of data analysis reports. The data analysis module, which interacts with the historical database, generates the analytical reports as requested by the user, and presents them for investigation to the user.
4. Investigate the data analysis reports. The user needs to carefully study the reports in accordance with the policy itself. She/he may choose to consult other policy designers in the organization.
5. Reports Look Satisfactory? If the reports do not look satisfactory, the user creates a new version of the policy appropriately, and then returns to step 2. Otherwise, the process stops.
Note that this model is only an abstraction of the entire process, and the actual process followed by an individual may differ in certain aspects. For instance, the user may request a data analysis expert to generate several analytical reports, with some variations in each of them. Also, the communication between the policy designer and the data analytics expert should ideally be noise-free to ensure that the analytical reports actually conform to the details specified by the former. Another drawback with having the analytical part of the process delegated to an area expert is the slower turn-around time of the process.
Moreover, the most significant drawback of such schemes is that the static data analysis report can be tuned to the policy only up to a limited extent, and the validity of the reports in view of the policy being analyzed may be questionable. Typically, the policy designer uses her/his intuition, insight and personal experience to account for such and other limitations of these techniques.
Finally, accessing a historical database may not always be convenient, and the analysis process may also be hampered by such issues. The model's dependence on historical data thus proves to be a handicap for the policy designers intending to work at remote or mobile locations (assuming, of course that the historical database is accessible only on the organization's intranet--which is typically the case). The historical database dependency also limits the scope of analysis to the time period and populace for which sufficient amount of data is available.
c. Decision Analysis Tools with Simulations
Some decision analysis tools do support what-if analysis using Monte Carlo simulations. However, such systems do not adequately support rule-based systems. Another aspect of such tools is that they are more tuned to performing the analysis on a set of mathematical equations and/or decision trees modeling the underlying policy. The analytics model thus differs significantly from the actual model in which the policy is deployed. In other words, the simulation based analytics tools do not serve to analyze business rules, which is arguably the most popular model for deploying business policies today.
d. Static Data Analysis Techniques
As mentioned earlier, powerful data analytics tools are the favorite resources used by the policy designers/analysts. With the advent of On-Line Analytical Processing (OLAP) technology, many sophisticated data analysis tools are accessible today. Though many of these have been automated to a large extent, they suffer because of the steep learning curve, and remain restricted to experts in the data analytics domain. A business policy designer, more often than not, delegates the tasks of generating the analysis reports to such experts.
Another more serious issue concerns the validity of these static data analysis reports. While these reports may serve well for studying the trends in data, with a possible indication of the future trends, or the direction in which the market might shift, they may not be very well suited for studying business policies. While it may be possible to have the analysis tuned (to a certain extent) to a business policy being studied, it requires a significant amount of time and other resources to facilitate the necessary communication between the policy designer and the data analytics expert. Consequently, the data analysis reports, which form a critical part of the entire process, become more sensitive to the accuracy with which the policy designer is able to explain the details to the analytics expert. These and other technicalities essentially degrade the efficiency and reliability of such traditional procedures of policy design and analysis.
e. Personal Variations
Though the methodology followed by most of the policy designers fits the abstract framework de-scribed above, the exact process followed by each designer may vary with the individual. Most of such variations occur in the steps 2 and 3 of procedure outlined above. For instance, an individual may prefer a different type of analysis report than someone else. Another variation may be in the weight assigned to the analysis reports in comparison with personal insight and experience. A policy designer may decide to view the past statistical reports on the day-to-day events logged by the deployment mechanism of an existing policy, or choose to study different statistical metrics altogether. Given these variations, the traditional methods remain largely manual as opposed to automated, invariably involving multiple individuals which inherently slows down the entire process.
Brief description of the invention
While the current solutions available in the business rules domain are primarily focused on maintaining and deploying business rules, the systems and methods discussed herein advance to the next step of analyzing the business policies encoded as business rules. Our method and system essentially studies the impact of adjusting some parameters in a business rule on the business metrics of the enterprise. In most cases, adjusting a business rule by changing some of the contained parameters improves some business metrics while simultaneously degrading others. Returning to the mortgage rules example, notice that by lowering the minimum-annual-income limit from $100000 to say $80000, while the total loan approved metric improves (that is, increases), the average risk associated with all the approved mortgage applications degrades (that is, the risk also increases, assuming that the risk involved is inversely proportional to the annual income of the applicant). In other words, the values that are chosen for the parameters in the rules are based on a compromise between effect on the conflicting business metrics.
Given the business objectives of the enterprise, which essentially translate to some desirable values for certain business metrics and acceptable values for the conflicting ones, our system offers various options to the user for adjusting the parameters in the business rules, along with the effect of each option on all the business metrics of the enterprise. The user can then select the option that meets all (or most of) the business targets of the enterprise. Our system and method provide the user with the ability to eliminate the dependence of the analysis process on historical data, and instead use simulated data which can be adjusted and filtered to closely represent real life data, or which can be combined with real life historical data to create dynamic hybrid models. An added advantage of using simulated data is the ability to analyze using hypothetical and/or futuristic data. In addition, we also support the ability to analyze using historical data maintained by the organization. Thus, it is an object of the present invention to provide a system and method to analyze the impact of varying some parameters in a business policy on the business metrics of the organization.
Another object of the present invention is to provide a system and method to a user for performing such analysis as mentioned above using either real-time data, historical data, simulated data, or a combination of historical and simulated data.
Additional related objects of the present invention will be discussed in the following text, or may be deduced from the discussed objects by an experienced user of the system. The objects of the present invention may be achieved by allowing the user to (a) specify (either by importing an existing version, or creating a new version of) a ruleset encoding a business policy, (b) specify the set of values to be assigned to each of the "adjustable business parameters" to be studied in the analytics model being created, (c) specify and configure the source of input data, and (d) specify the business metrics to be tracked during the analysis.
Provided herein are methods and systems for designing, analyzing, exploring and implementing business policies via business rules analysis. The computer based method may involve identifying the business metrics, selecting the business metrics to be tracked, and deciding on the registers to be maintained for each of them; selecting the business rules that affect the chosen business metrics, and, if applicable, generating rulesets or specific rules corresponding to such business metrics or sets of business metrics; identifying the decision-parameters to be varied during the analysis, the range of values which the decision parameters can assume, and also deselecting or eliminating any decision parameters or sets of decision parameters not related to the ultimate business objects and metrics being analyzed; configuring the input data source, selecting historical, simulated, or hybrid data including historical, realtime or simulated data, using specified algorithms to create simulated or hybrid data model; using the various data sources, including the simulated and hypothetical data and the corresponding business metric, decision parameters, scenario, and register data, to execute various rules and rulesets, and to analyze outcomes, corresponding business metric data, and corresponding decision parameter data; storing the results of each such execution or running them independently and storing the corresponding outcomes and data independently so that it can be accessed, queried, or investigated as and when desired; and repeating the above steps to generate additional data and fine-tune analysis.
The method may be carried out by a single user or multiple users through single or multiple user devices. The user of the method may be selected from the group consisting of an employee, a consultant, a manager, a corporate officer, a financial officer, a compliance officer, a board member, a government official, a supervisor, an attendant, a team member, a system administrator, a contractor, a vendor, a clerk, a coach, a cashier, a strategist, a choreographer, a planner, a military official, a gaming employee, a gaming manager, an auditor, a teller, a comptroller, an accountant, an attorney, a paralegal, a principal, an administrator, a human resources employee, a broker, a law enforcement agent, a law enforcement agency, a government agency, and a government.
The business policy output can be generated on specific sets of the data as specified by the user according to the desired business metrics, decision parameters, and/or scenarios which such user chooses to analyze. The user may categorize parameters in business rules and/or decision tables as decision parameters, and sets up an analytics model to determine the values for these parameters in order to evaluate, analyze, optimize, or otherwise modify the business metrics of the organization.
The user may focus on a specific ruleset, rule, rule or ruleset outcome, business metric or set of business metrics, decision parameter or set of decision parameters, using such focus to adjust business policy or measure specific effects of business policy. The user may automatically generate values or combinations of values for decision parameters.
The input data source may be historical data, where such historical data may be stored in a firm or organization's local database, imported from specified external sources, or generated within a very short space of time following the occurrence of specified events. The input data source may be "realtime" data, where such realtime data may be collected through data collection devices deployed within a firm or organization such that data is transmitted as soon as an event has occurred so that the resulting data analysis may be considered current relative to specified time increments or with specified time-lag. The input data source may be simulated data provided by the user, where such simulated data may be simulated for all data points or may be combined with historical data to execute rulesets and conduct business rule analysis.
The simulated data may be generated according to specified algorithms, including Monte Carlo simulation. The simulated data may be generated by use of various modes of distribution including but not limited to random and bounded, random and unbounded, constant, discrete, Gaussian random, weighted random, and expression. The simulated data may be used to modify data sets, data rows, and data groups.
The simulated data generated may be used to evaluate application of existing business policy and business rules in different geographic or demographic settings, where the input data provided by user includes hypothetical or simulated data different from the firm or organization's historical geographic and/or demographic data. The simulated data may be used to evaluate application of existing business policy and business rules at different times where historic data may not exist, including any time in the future and any time in the past for which there is no historical data.
A user may store sets of simulated data or simulated data outcomes for use with subsequent simulated data entries, where the body of such existing sets can be stored as a library and accessed according to decision parameters, business metrics, scenarios, simulation algorithm, and other prescribed criteria. A user may progress from coarse to fine grain analysis through iterative use of hypothetical, historical, or hybrid data, narrowing the values of a particular decision parameter with each iteration, and thereby determine with a higher degree of accuracy the most significant value range for a given decision parameter.
A user may use statistical metrics including, but not limited to "MINIMUM", "MAXIMUM", "SUM", "AVERAGE", "COUNT", "THRESHOLD" and "RANGE" to determine specific effects on particular business metrics. The statistical metrics may be extended to all such metrics that can be computed on a streaming data model.
A user may be further provided with the ability to impose logical "AND/OR" constraints defined in connection with certain business terms of a given policy on the registers to be tracked and analyzed for business metrics.
A user may employ a reverse lookup functionality or other such query functionality to determine the combination of values for the decision-parameters which corresponds to a particular desirable impact on the business metrics. A user may profile the decision tables for a particular ruleset or rulesets and thereby determine the frequency of each cell of the decision table being fired/activated, or such frequency as applied to groups of cells within a given decision table or cells or groups of cells across multiple decision tables.
A user may simultaneously analyze the impact of decision parameter changes on multiple business metrics. A user is provided the ability to classify certain result sets as unacceptable by specifying certain unacceptable values for certain business metrics, wherein the user can use such classification to focus the rule or business policy analysis on a limited set of relevant business metrics. A user is also provided with the ability to identify the most critical decision-parameter of a policy, which is defined as a decision-parameter which, if changed by a certain percentage, has the greatest impact on the business metrics as compared to the impact by changing any other decision-parameter by the same percentage.
The method may also involve using the analytic outcomes or results generated for a particular business policy or set of business rules to activate a mechanism which automatically replaces the current or deployed version of the policy or set of business rules with a modified and more effective version which incorporates the rule changes recommended by such outcomes or results.
An analytics model derived from the method or the results produced by such method may be persisted to disk or other storage medium for future reuse and/or investigation and comparison with other variations of the same model or comparison with other different models.
The analytics model and the historical, simulated, or realtime data may relate to loan approval, loan processing, eligibility, prequalification in mortgage industry, automation, policy pricing, new product launches in insurance sector, portfolio credit risk, fraud detection, regulatory compliance, capital adequacy in banking and financial services industry, plans and billing rates in telecom services sector, promotional campaigns, discounts, pricing, contract in ecommerce industry, shipping rates, routing, capacity planning in transportation and travel sector, customs processing, visa processing, application processing, management of social welfare schemes in Government organizations, eligibility, calculation of treatment costs, regulatory compliance in healthcare sector.
The output of the method may be used to improve the business metrics of a given firm or organization or to monitor the application of business rules within a given firm or organization. The output for various firms, organizations, subsidiaries, or branch offices may be collated and used to provide generalized recommendations regarding optimal application of particular business rules. The output may be used to provide third party clients with data for planning and strategy in connection with their own business rules and operations which have not yet been implemented. The output for various firms, organizations, subsidiaries, or branch offices may be collated and used to provide generalized recommendations regarding optimal application of particular business rules. The output may be based on various bodies or libraries of hypothetical, historical, and hybrid data used to provide third party clients with data for planning and strategy in connection with their own business rules and operations which have not yet been implemented.
The output may be used to evaluate the prospective or actual effects of a body of regulations, where such body of regulations can be represented by a set of rules or rulesets which can be analyzed by said system. The user may generate one or a plurality of reports generated from the output. The report may be customized. The report may reflect the results of data mining operations performed on the output. The report may be searched. The report may include a summary of aspects of the output. The report may include statistical information relative to the output. The report may include temporal information relative to the output. The report may include frequency information relative to the output. The report may exclude, segregate or filter out incidents of low frequency. The report may cover a specified period of time. The period of time may be a day, week, month, fiscal quarter, calendar quarter, fiscal year, or calendar year. The information included in the report may be aggregated, analyzed, processed, compiled, or organized.
The system may involve a facility for identifying the business metrics, selecting the business metrics to be tracked, and deciding on the registers to be maintained for each of them; a facility for selecting the business rules that affect the chosen business metrics, and, if applicable, generating rulesets or specific rules corresponding to such business metrics or sets of business metrics; a facility for identifying the decision-parameters to be varied during the analysis, the range of values which the decision parameters can assume, and also deselecting or eliminating any decision parameters or sets of decision parameters not related to the ultimate business objects and metrics being analyzed; a facility for configuring the input data source, selecting historical, simulated, or hybrid data including historical, realtime or simulated data, using specified algorithms to create simulated or hybrid data models; a facility for using the various data sources, including the simulated and hypothetical data and the corresponding business metric, decision parameters, scenario, and register data, to execute various rules and rulesets, and to analyze outcomes, corresponding business metric data, and corresponding decision parameter data; a facility for storing the results of each such execution or run independently and storing the corresponding outcomes and data independently so that it can be accessed, queried, or investigated as and when desired; a facility for repeating the above steps to generate additional data and fine-tune analysis.
A single user or multiple users may interface with the system through single or multiple user devices. The user of the system may be selected from the group consisting of an employee, a consultant, a manager, a corporate officer, a financial officer, a compliance officer, a board member, a government official, a supervisor, an attendant, a team member, a system administrator, a contractor, a vendor, a clerk, a coach, a cashier, a strategist, a choreographer, a planner, a military official, a gaming employee, a gaming manager, an auditor, a teller, a comptroller, an accountant, an attorney, a paralegal, a principal, an administrator, a human resources employee, a broker, a law enforcement agent, a law enforcement agency, a government agency, and a government.
A system facility may permit a business policy output to be generated on specific sets of the data as specified by a user according to the desired business metrics, decision parameters, and/or scenarios which such user chooses to analyze. A system facility may permit a user to categorize parameters in business rules and/or decision tables as decision parameters, and to set up an analytics model to determine the values for these parameters in order to evaluate, analyze, optimize, or otherwise modify the business metrics of the organization. A system facility may enable a user to focus on a specific ruleset, rule, rule or ruleset outcome, business metric or set of business metrics, decision parameter or set of decision parameters, using such focus to adjust business policy or measure specific effects of business policy. A system facility may automatically generate values or combinations of values for decision parameters.
The input data source may be historical data, where such historical data may be stored in a firm or organization's local database, imported from specified external sources, or generated within a very short space of time following the occurrence of specified events. The input data source may be "realtime" data, where such realtime data may be collected through data collection devices or agents deployed within a firm or organization such that data is transmitted as soon as an event has occurred so that the resulting data analysis may be considered current relative to specified time increments or with specified time-lag. The input data source may be simulated data provided by the user, where such simulated data may be simulated for all data points or may be combined with historical data to execute rulesets and conduct business rule analysis.
A system facility may generate simulated data according to specified algorithms, including Monte Carlo simulation, and wherein the simulated data may be generated by use of various modes of distribution including but not limited to random and bounded, random and unbounded, constant, discrete, Gaussian random, weighted random, and expression. The simulated data may be used to modify data sets, data rows, and data groups. The simulated data generated may be used to evaluate application of existing business policy and business rules in different geographic or demographic settings, where the input data provided by user includes hypothetical or simulated data different from the firm or organization's historical geographic and/or demographic data.
The simulated data may be used to evaluate application of existing business policy and business rules at different times where historic data may not exist, including any time in the future and any time in the past for which there is no historical data. A system facility may store sets of simulated data or simulated data outcomes for use with subsequent simulated data entries, where the body of such existing sets can be stored as a library and accessed according to decision parameters, business metrics, scenarios, simulation algorithms, and other prescribed criteria.
A system facility may be provided for a user to proceed from coarse to fine grain analysis through iterative use of hypothetical, historical, or hybrid data, to narrow the values of a particular decision parameter with each iteration, and to thereby determine with a higher degree of accuracy the most significant value range for a given decision parameter. The system includes a facility employing statistical metrics including, but not limited to "MINIMUM", "MAXIMUM", "SUM", "AVERAGE", "COUNT", "THRESHOLD" and "RANGE" to determine specific effects on particular business metrics
A functionality may be provided to extend the statistical metrics to all such metrics that can be computed on a streaming data model. A user may be provided with a facility to impose logical "AND/OR" constraints defined in connection with certain business terms of a given policy on the registers to be tracked and analyzed for business metrics. A reverse lookup functionality or other such query functionality may be provided for the user to determine the combination of values for the decision-parameters which corresponds to a particular desirable impact on the business metrics.
A facility may be provided to profile the decision tables for a particular ruleset or rulesets and thereby determine the frequency of each cell of the decision table being fired/activated, or such frequency as applied to groups of cells within a given decision table or cells or groups of cells across multiple decision tables. A facility may be provided to simultaneously analyze the impact of decision parameter changes on multiple business metrics. A facility may be provided to classify certain result sets as unacceptable by specifying certain unacceptable values for certain business metrics, wherein the facility enables a user to use such classification to focus the rule or business policy analysis on a limited set of relevant business metrics.
A facility may be provided to identify the most critical decision-parameter of a policy, which is defined as a decision-parameter which, if changed by a certain percentage, has the greatest impact on the business metrics as compared to the impact by changing any other decision-parameter by the same percentage.
The system may comprise a facility which uses the analytic outcomes or results generated for a particular business policy or set of business rules to activate a mechanism which automatically replaces the current or deployed version of the policy or set of business rules with a modified and more effective version which incorporates the rule changes recommended by such outcomes or results.
An analytics model derived from the system or the results produced by the system may be persisted to disk or other storage medium for future reuse and/or investigation and comparison with other variations of the same model or comparison with other different models.
The analytics model and the historical, simulated, or realtime data may relate to loan approval, loan processing, eligibility, prequalification in mortgage industry, automation, policy pricing, new product launches in insurance sector, portfolio credit risk, fraud detection, regulatory compliance, capital adequacy in banking and financial services industry, plans and billing rates in telecom services sector, promotional campaigns, discounts, pricing, contract in ecommerce industry, shipping rates, routing, capacity planning in transportation and travel sector, customs processing, visa processing, application processing, management of social welfare schemes in Government organizations, eligibility, calculation of treatment costs, regulatory compliance in healthcare sector.
The system output may be used to improve the business metrics of a given firm or organization or to monitor the application of business rules within a given firm or organization. The system output for various firms, organizations, subsidiaries, or branch offices is collated and used to provide generalized recommendations regarding optimal application of particular business rules. The output may be used to provide third party clients with data for planning and strategy in connection with their own business rules and operations which have not yet been implemented.
The system output may be used to evaluate the prospective or actual effects of a body of regulations, where such body of regulations can be represented by a set of rules or rulesets which can be analyzed by said system. One or a plurality of reports may be generated from the output. The report may be customized. The report may reflect the results of data mining operations performed on the output. The report may be searched. The report may include a summary of aspects of the output. The report may include statistical information relative to the output. The report may include temporal information relative to the output. The report may include frequency information relative to the output. The report may exclude, segregate or filter out incidents of low frequency.
The report may cover a specified period of time. The period of time may be a day, week, month, fiscal quarter, calendar quarter, fiscal year, or calendar year. The information included in the report may be aggregated, analyzed, processed, compiled, or organized.
A computer-based method involving identifying business metrics of interest, including related business rules and decision parameters; selecting the data source or sources to be used; performing analysis by varying the decision parameters across all values of interest and in all combinations of interest; and storing the results of the analysis. The data source may include any one or more of historical data, realtime data and simulated data. The stored results may be queried. Reports may be generated based on the stored data. The method may be repeated with at least one change based on the results. A user may simultaneously analyze the impact of decision parameter changes on multiple business metrics.
The description continues in the full USPTO document.
 Lapsed, fee not paid13 drawings