Lapsed, fee not paid11 drawings
Industrial Equipment · US 8,701,750 B2
Heat exchanger
One or more embodiments of the present invention relates to a heat exchanger.
US 8,701,762 B2 · Assignee: Schlumberger Technology Corporation · Inventors: Shako; Valery Vasilievich et al.
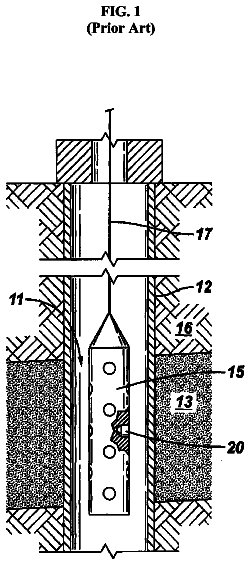
Sheet 1 of 4 from the published document. All sheets in the USPTO PDF
Method is directed to determining a fluid influx profile and near-wellbore area parameters in multi-layered reservoirs. A bottomhole pressure in a wellbore is measured. After operation of the wellbore at a constant production rate, the production rate is changed. A bottomhole pressure is measured together with a fluid influx temperature for each productive layer. Graphs of the fluid influx temperature measured as a function of time and of a derivative of this temperature with respect to a logarithm of a time passed after the production rate is changed as a function of time are plotted. Relative production rates and skin factors of the productive layers are calculated based on these graphs.
A method to determine relative production rates of productive layers of a reservoir using quasi-steady flux temperature values measured along a wellbore is described in, e.g.: Ceremenskij G. A. Prikladnaja geotermija, Nedra, 1977 p. 181. Disadvantages of the method include low accuracy in determining the layers' relative flow rate, resulting from the assumption that the Joule-Thomson effect does not depend on time and is the same for different layers. In fact, it depends on the formation pressure and specific layers pressure values.
1 of 4 drawing sheets so far from the published document, cropped to the drawing. Every sheet is in the USPTO PDF.
What the patent claimed, word for word. All of it is now free to use.
This application claims priority to Russian Application Serial No. 2010139992 filed Sep. 30, 2010, which is incorporated herein by reference in its entirety.
The invention relates to the area of geophysical studies of oil and gas wells, particularly, to the determination of a fluid influx profile and multi-layered reservoir near-wellbore area space parameters.
A method to determine relative production rates of productive layers of a reservoir using quasi-steady flux temperature values measured along a wellbore is described in, e.g.: Ceremenskij G. A. Prikladnaja geotermija, Nedra, 1977 p. 181. Disadvantages of the method include low accuracy in determining the layers' relative flow rate, resulting from the assumption that the Joule-Thomson effect does not depend on time and is the same for different layers. In fact, it depends on the formation pressure and specific layers pressure values.
The technical result of the invention is an increased accuracy in determining wellbore parameters (influx profile, values of skin factors for separate productive layers).
The method for determining a fluid influx profile and near-wellbore area parameters comprises the following steps. A first bottomhole pressure is measured in a wellbore. The production rate is changed after a long-term operation of the wellbore at a constant production rate during a time sufficient to provide a minimum influence of the production time on the rate of the subsequent change of the temperature of the fluids flowing from the production layers into the wellbore. After changing the production rate, a second bottomhole pressure and a temperature of a fluid influx for each productive layer are measured. Graphs of the fluid influx temperature as a function of time and graphs of a derivative of this temperature with respect to a logarithm of time passed after the production rate has been changed as a function of time are plotted. Times at which the temperature derivatives become constant are determined from the plotted graphs of the derivative of the fluid influx temperature with respect to logarithm of time passed after the production rate has been changed as a function of time. Influx temperature changes corresponding to these times are also determined from the plotted graphs of the fluid influx temperature as a function of time. Relative flow rates and skin factors of the layers are calculated using the values obtained and the measured influx temperatures and the bottomhole pressures measured before and after the production rate has been changed.
FIG. 1 shows the influence of a production time on a temperature change rate after the production rate has been changed;
FIG. 2 shows changes in derivatives of temperature of fluid influxes from different productive layers with respect to a logarithm of a time passed after a production rate has changed. Times t.sub.d,1 and t.sub.d,2 are marked after the temperature derivatives become constant (these values are used to calculate relative production rates of the productive layers);
FIG. 3 shows graphs of an influx temperature as a function of time and determination of the influx temperature changes .DELTA.T.sub.d,1 and .DELTA.T.sub.d,2 (by the times t.sub.d,1 and t.sub.d,2) used to calculate skin factors of the productive layers for a two-layer wellbore model; and
FIG. 4 shows a bottomhole pressure as a function of time passed after a change in production rate.
The method presented herein is based on a simplified model of heat- and mass-transfer processes in a productive layer and a wellbore. Let us consider the results of applying a model that processes the measurement results of the temperature T.sub.in.sup.(i)(t) of fluids flowing into a wellbore from two productive layers.
Pressure profiles in the productive layers are characterized by fast stabilization. After the production rate has been changed, rate of change in the temperature of the fluid flowing into the wellbore is described by the equation:
dd.theta..function..times..times..delta..function. ##EQU00001##
where .epsilon..sub.0 is a Joule-Thomson coefficient, P.sub.e is a layer pressure, P.sub.1 and P.sub.2 are a first bottomhole pressure measured before and a second bottomhole pressure measured after the production rate has been changed, s is a skin factor of a productive layer, .theta.=ln(r.sub.e/r.sub.w), r.sub.e is a drain radius, r.sub.w is a wellbore radius, t is the time passed from the moment when the production rate has been changed, t.sub.p is a production time at the first bottomhole pressure of
.delta..times..function..ltoreq.<.times..times..theta. ##EQU00002## K is a relative permeability of a near-wellbore zone, .theta..sub.d=ln(r.sub.d/r.sub.w), r.sub.d is an external radius of the near-wellbore zone with a different permeability as compared with a layer far away from the wellbore. The external radius of the near-wellbore zone is determined by a set of factors, like perforation hole properties, permeability distribution in the affected zone around the wellbore and drilling incompleteness, t.sub.d1=t.sub.1D and t.sub.d2=t.sub.2D are certain characteristic heat-exchange times in a first productive layer and in a second productive layer, D=(r.sub.d/r.sub.w).sup.2-1 is a non-dimensional parameter characterizing a size of the near-wellbore zone,
.pi..chi..times..times..pi..mu..theta. ##EQU00003## --specific volumetric production rates before and after the production rate has been changed, Q.sub.1,2, h and k are volumetric production rates, thickness and permeability of a layer respectively,
.chi..rho..rho..times..rho..times..PHI..rho..times..PHI..rho..times. ##EQU00004## .phi. is a layer porosity, .rho..sub.fc.sub.f is a volumetric heat capacity of the fluid, .rho..sub.mc.sub.m is a volumetric heat capacity of a rock matrix, .mu. is fluid viscosity.
According to Equation (1), if a relatively long production time t.sub.p passes before the production rate is changed, its influence on the temperature change dynamics trends towards zero. Let us evaluate this influence. For the order of magnitude .chi..apprxeq.0.7, r.sub.w.apprxeq.0.1 m, and for r.sub.d.apprxeq.0.3 m q=100 [m.sup.3/day]/3 m.apprxeq.410.sup.-4 m.sup.3/s, we have: t.sub.2.apprxeq.0.03 hours, t.sub.d2.apprxeq.0.25 hours. If the measurement time t is t.apprxeq.2/3 hours (i.e. t>>t.sub.2, t.sub.d2 and f(t, t.sub.d2)=1), it is possible to evaluate what relative error is introduced into the derivative
value by the finite time of the production before the measurements:
.DELTA..function. ##EQU00005##
FIG. 1 shows results of calculations using Equation
for P.sub.e=100 Bar, P.sub.1=50 Bar, P.sub.2=40 Bar and t.sub.p=5, 10 and 30 days. From the Figure we can see, for example, that if the time of production at a constant production rate was 10 or more days, then within t=3 hours after the change in production rate, the influence of the t.sub.p value on the influx temperature change rate will not exceed 6%.
When it is assumed that the production time t.sub.p is long enough, Equation
may be written as:
dd.apprxeq..theta..function. ##EQU00006##
From Equation (4), one can see that at a sufficiently long time t>t.sub.d,
.pi..chi. ##EQU00007##
The rate of temperature change as a function of time is described as a simple proportion:
dd.times..times. ##EQU00008##
Numerical modeling of the heat-exchange and mass-exchange processes in the productive layers and the production wellbore shows that the time t=t.sub.d may be identified on a graph of
dd.times..times. ##EQU00009## versus time as the beginning of a constant value of the logarithmic derivative.
Assuming that dimensions of bottomhole areas in different layers are approximately equal (D.sub.1.apprxeq.D.sub.2), then using times t.sub.d,1 and t.sub.d,2, relative production rates may be found for two different layers using the following equations:
.times..times..times. ##EQU00010## ##EQU00010.2## ##EQU00010.3##
In general relative production rates of the second, third, etc., layers are calculated using the following equations:
.times..times..times..times..times..times..times..times..times..times..ti- mes..times..times..times..times..times..times..times. ##EQU00011##
such that for an i+1 layer a relative production rate is
.times. ##EQU00012##
where Y.sub.i+1 is a relative production rate of (i+1) layer, i=1, 2 . . . , .sub.1 h.sub.k is a thickness of a first k layer, k=1, 2 . . . i, t.sub.d,k is a time at which a temperature derivative becomes constant on a second graph of the temperature derivative with respect to a logarithm of time passed after the production rate has been changed as a function of time plotted for the first k layer, h.sub.i+1 is a thickness of an (i+1) layer, t.sub.d,i+1 is a time at which a temperature derivative becomes constant on a second graph of the temperature derivative with respect to a logarithm of time passed after the production rate has been changed as a function of time plotted for the (i+1) layer.
Equation
is obtained for a cylindrically symmetrical flow in a layer and a near-wellbore zone, which has an external radius r.sub.d. The temperature distribution in the-near-wellbore zone is different from the temperature distribution away from the wellbore. After the production rate has been changed, this temperature distribution is carried over into the well by the fluid flow which results in the fact that the nature of the T.sub.in(t) dependence at short times (after the production rate has been changed) differs from the T.sub.in(t) dependence observed at long (t>t.sub.d) time values. From Equation (7), one can see that with an accuracy to .chi. coefficient a volume of the produced fluid which is required for the transition to a new type of the dependence of the fluid influx temperature T.sub.in(t) versus time is determined by a volume of the near-wellbore zone:
.chi..pi. ##EQU00013##
In case of a perforated wellbore, there always is a "near-wellbore" zone (regardless of the distribution of permeabilities) in which the temperature distribution is different from the temperature distribution in a layer away from the wellbore. This is an area where the fluid flow is not symmetrical and the size of this area depends on a length of perforation tunnels (L.sub.p):
.apprxeq. ##EQU00014##
Assuming that lengths of the perforation tunnels in different productive layers are approximately equal (D.sub.p1.apprxeq.D.sub.p2), then relative production rates of the layers are also determined by Equation (6). Equation
may be updated by introducing a numerical coefficient of about 1.5-2.0, the value of which may be determined from a comparison with numerical calculations or field data.
To determine a skin factor s of a layer, a change in temperature .DELTA.T.sub.d of a fluid flowing into the wellbore during the time from the beginning of the production rate change until a time t.sub.d is used:
.DELTA..times..times..intg..times.dd.times.d ##EQU00015##
Using Equation (4), we find:
.DELTA..times..times..theta..theta. ##EQU00016##
where .DELTA.T.sub.d is the change of the influx temperature by the time t=t.sub.d, (P.sub.1-P.sub.2) is a difference between the first bottomhole pressure measured before the production rate has been changed and the second bottomhole pressure achieved in the wellbore several hours after the wellbore production rate has been changed. Whereas Equation
does not consider the influence of the end layer pressure field tuning rate, Equation
includes a non-dimensional coefficient c (approximately equal to one), the value of which is updated by comparing with the numerical modeling results.
According to (10), the skin factor s of a layer is calculated using the equations below.
.psi..theta..theta..psi..times..times..times..times..psi..DELTA..times..t- imes. ##EQU00017##
Therefore the determination of the influx profile and skin factors of the productive layers includes the following steps:
1. A first bottomhole pressure is measured. A wellbore is operated at a constant production rate for a long time (from 5 to 30 days depending on the planned duration and measurement accuracy requirements).
2. The production rate is changed and a second bottomhole pressure and temperature T.sub.in.sup.(i)(t) of fluids flowing into the wellbore from different productive layers are measured.
3. Derivatives from the measured fluid influx temperatures dT.sub.in.sup.(i)/dlnt are calculated and relevant graphs are plotted.
4. From these graphs, values of t.sub.d,i are found as time moments starting from at which the derivatives dT.sub.in.sup.(i)/dlnt become constant and using Equation (6), relative production rates of the layers are calculated.
5. From graphs T.sub.in.sup.(i)(t) values of temperature changes .DELTA.T.sub.d.sup.(i) at t.sub.d,i time moments are determined and using Equation (11), skin factors of the productive layers are found.
The temperature of fluids flowing into the wellbore from the productive layers may be measured using, for example, the apparatus described in WO 96/23957. The possibility of determining an influx profile and skin factors of productive layers using the method described herein was checked on synthetic examples prepared by using a numerical simulator of the producing wellbore. The simulator simulates an unsteady pressure field in the wellbore-layers system, a non-isothermal flow of compressible fluids in a heterogeneous porous medium, mixing of the flows in the wellbore, and wellbore-layer heat exchange, etc.
FIG. 2-4 shows the results of the calculation for the following two-layer model:
k.sub.1=100 mD, s.sub.1=0.5, h.sub.1=4 m
k.sub.2=500 mD, s.sub.2=7, h.sub.2=6 m
The production time at a production rate of Q.sub.1=300 m.sup.3/day is t.sub.p=2000 hours; Q.sub.2=400 m.sup.3/day. FIG. 4 shows that in this case the wellbore pressure continues to change considerably even after 24 hours. FIG. 2 provides graphs of the derivatives of the influx temperature T.sub.in,1 and T.sub.in,2 with respect to the logarithm of time passed after the wellbore production rate has been changed. From the Figure it can be seen that the derivatives dT/dint become constant respectively, at t.sub.d,1=0.5 hours and t.sub.d,2=0.3 hours. Using these values, a relative production rate for an upper layer of 0.72 is found, which is close to the true value (0.77). From the graph of influx temperature as a function of time (FIG. 3), .DELTA.T.sub.d,1=0.064K and .DELTA.T.sub.d,2=0.152K are found. The layer skin factors calculated using the obtained values of .DELTA.T.sub.d,1 and .DELTA.T.sub.d,2 and Equation
at c=1.1 differ from the true values of skin factors by less than 20%.
About 2,176 words. The USPTO PDF has it with every drawing.
Fees are due 3.5, 7.5 and 11.5 years after grant. This patent expired on April 22, 2026, so the fee marked "not paid" was the one that went unpaid.
METHOD OF DETERMINATION OF FLUID INFLUX PROFILE AND NEAR-WELLBORE SPACE PARAMETERS
Filed Sep 2011 · published May 2012Method of determination of fluid influx profile and near-wellbore space parameters
Filed Sep 2011 · granted Apr 2014Earlier publications, parents and continuations. None of them can still be enforced, or this patent would not be listed.
Prior art cited by the examiner or applicant. Useful when you check your own idea for novelty.
Everything on this page comes from the documents linked above.