Technical field
The present invention relates to a driving assistance system for vehicle, which assists efforts by drivers to operate vehicles in traveling.
Background art
A conventional driving assistance system for vehicle learns time to contact at the start of deceleration when the vehicle is approaching a leading vehicle ahead and generates an alarm based on a learnt value (see, for example, patent reference literature 1). The system estimates a predicted time of the driver from the time to contact at the start of deceleration operation and generates an alarm when the predicted value of the vehicle separation after the predicted time becomes smaller than an alarm distance.
Patent Reference Literature 1 Japanese Laid Open Patent Publication No.
H7-159525
Patent Reference Literature 2 Japanese Laid Open Patent Publication No. 2005-71184
Disclosure of the invention
Problems to be Solved by the Invention
The conventional system described above detects driving characteristics of the driver based on the time to contact at the start of deceleration operation and generates an alarm when an unsafe state is detected. However, there has been a problem that the convincingness of the driver towards the alarm is reduced if reliable detection is not assured due to noise generated by variations between drivers (interindividual difference) or variations in each driver (intraindividual difference).
Means for Solving the Problems
A driving assistance system for vehicle according to the present invention comprises: a traveling condition detection means that detects a traveling condition of a vehicle; a drive operation detection means that detects a drive operation by a driver; a drive diagnosis means that calculates an index for drive diagnosis based upon the traveling condition detected by the traveling condition detection means and the drive operation detected by the drive operation detection means, and diagnoses a drive operation of the driver from a calculated index; an information setting means that evaluates a drive diagnosis result by the drive diagnosis means in accordance with an evaluation criterion so as to set a content of information provision to the driver; and an information provision means that performs information provision to the driver with a content set by the information setting means.
A driving assistance method for vehicle according to the present invention: detects a traveling condition of a vehicle; detects a drive operation by a driver; calculates an index for drive diagnosis based upon the traveling condition and the drive operation that have been detected, and diagnosing an operation of the driver from a calculated index; evaluates a drive diagnosis result with an evaluation criterion so as to set a content of information provision to the driver; and performs information provision to the driver with the set content.
Advantageous Effect of the Invention
According to the present invention, information provision with high convincingness of the driver can be carried out accurately because drive diagnosis result is evaluated in accordance with an evaluation criterion so as to set information provision contents.
Brief description of the drawings
FIG. 1 A control diagram showing a driving assistance system for vehicle according to a first embodiment of the present invention
FIG. 2 A view illustrating how the driving assistance system for vehicle shown in FIG. 1 is arranged on an automobile
FIG. 3 A flow chart illustrating the processing procedure of a driving assistance control program achieved in the first embodiment
FIG. 4 An illustration of the data structure
FIG. 5 A flow chart illustrating the procedure of driver operation diagnosis processing
FIGS. 6 (a) to (d) Illustrations of calculation methods of degree of deviation
FIGS. 7 (a) and (b) Illustrations of calculation methods of degree of deviation using time to contact TTC
FIG. 8 An illustration of one example of visual information presentation
FIG. 9 An illustration of another example of visual information presentation
FIG. 10 A control diagram showing the driving assistance system for vehicle according to a second embodiment of the present invention
FIG. 11 A flow chart illustrating the processing procedure of driving assistance control program achieved in the second embodiment
FIG. 12 A timing diagram illustrating an example of a variation curve of time to lane crossing
FIG. 13 A timing diagram illustrating an example of a frequency distribution of time to lane crossing
FIG. 14 A timing diagram illustrating an example of variations of time to lane crossing
FIG. 15 A flow chart illustrating the procedure of driver operation diagnosis processing
FIG. 16 A flow chart illustrating the processing procedure of the driving assistance control program achieved in a third embodiment
FIG. 17 A flow chart illustrating the procedure of driver operation diagnosis processing
FIG. 18 An illustration of one example of visual information presentation
FIG. 19 An illustration of another example of visual information presentation
FIGS. 20 (a) and (b) Illustrations of calculation methods of degree of deviation using vehicle velocity limits
FIG. 21 A control diagram showing the driving assistance system for vehicle according to a fourth embodiment of the present invention
FIG. 22 A view illustrating how the driving assistance system for vehicle shown in FIG. 21 is arranged on an automobile
FIG. 23 A flow chart illustrating the processing procedure of the driving assistance control program achieved in the fourth embodiment
FIG. 24 An illustration of the structure of a traffic road database
FIG. 25 An illustration of the data structure
FIG. 26 A flow chart illustrating the procedure of driver operation diagnosis processing
FIGS. 27 (a) and (b) Illustrations of distribution and normal distribution of time headway THW
FIGS. 28 (a) to (d) Illustrations of calculation methods of degree of deviation
FIGS. 29 (a) and (b) Illustrations of calculation methods of degree of deviation of "this moment" relative to "this day"
FIG. 30 An illustration of one example of visual information presentation
FIG. 31 An illustration of another example of visual information presentation
FIG. 32 A flow chart illustrating the processing procedure of the driving assistance control program achieved in a fifth embodiment
FIG. 33 An illustration of the data structure of the fifth embodiment
FIG. 34 A flow chart illustrating the procedure of driver operation diagnosis processing
FIG. 35 An illustration of one example of visual information presentation
FIG. 36 A flow chart illustrating the processing procedure of the driving assistance control program achieved in a sixth embodiment
FIG. 37 A flow chart illustrating the procedure of driver operation diagnosis processing
FIG. 38 An illustration of the setting method of bins
FIGS. 39 (a) and (b) Illustrations of the setting method of initial values to be put in the bins
FIG. 40 An illustration of degree of deviation calculation method using mode
FIG. 41 A control diagram showing the driving assistance system for vehicle according to a seventh embodiment of the present invention
FIG. 42 A flow chart illustrating the processing procedure of the driving assistance control program achieved in the seventh embodiment
FIG. 43 A flow chart illustrating the procedure of driver operation diagnosis processing
FIG. 44 An illustration of one example of visual information presentation
FIG. 45 An illustration of another example of visual information presentation
FIG. 46 A flow chart illustrating the processing procedure of the driving assistance control program achieved in an eighth embodiment
FIG. 47 A flow chart illustrating the procedure of driver operation diagnosis processing
FIG. 48 A flow chart illustrating the processing procedure of the driving assistance control program achieved in a ninth embodiment
FIG. 49 A flow chart illustrating the procedure of driver operation diagnosis processing
FIG. 50 A control diagram showing the driving assistance system for vehicle according to a tenth embodiment of the present invention
FIG. 51 A flow chart illustrating the processing procedure of the driving assistance control program achieved in the tenth embodiment
FIG. 52 A table of symbols used for steering angle entropy calculations
FIG. 53 A flow chart illustrating the procedure of calculation processing of steering angle entropy
FIG. 54 A table of steering angle bins
FIG. 55 An example of categories of long-duration steering angle entropy calculation results
FIG. 56 An example of relationship between long-duration steering angle entropy categories and contents to be informed
FIG. 57 A flow chart illustrating the processing procedure of the driving assistance control program achieved in the variation 1 of the tenth embodiment
FIG. 58 A flow chart illustrating the processing procedure of the driving assistance control program achieved in the variation 1 of the tenth embodiment
FIG. 59 A flow chart illustrating the calculation processing procedure of a value of a reference state
FIG. 60 A table of categories of steering errors
FIG. 61 A frequency distribution table of steering errors
FIG. 62 An example of categories of intermediate-duration steering angle entropy calculation results
FIG. 63 An example of relationship between intermediate-duration steering angle entropy categories and contents to be informed
FIG. 64 An example of categories of comparison results of a previous intermediate-duration steering angle entropy and a measured intermediate-duration steering angle entropy
FIG. 65 A table of relationship between categories of comparison results of a previous intermediate-duration steering angle entropy and a measured intermediate-duration steering angle entropy and contents to be informed
FIG. 66 An example of categories of calculation results of a steering angle error distribution a value
FIG. 67 An example of relationship between categories of the steering angle error distribution a value and contents to be informed
FIG. 68 A flow chart illustrating the processing procedure of the driving assistance control program achieved in the variation 2 of the tenth embodiment
FIG. 69 An example of categories of short-duration steering angle entropy calculation results
FIG. 70 An example of relationship between short-duration steering angle entropy categories and contents to be informed
FIG. 71 A flow chart illustrating the calculation processing procedure of steering angle entropy in an eleventh embodiment
FIG. 72 A flow chart illustrating the method to recursively calculate the probability of categories using steering angle estimation error data
FIG. 73 A flow chart illustrating the calculation processing procedure of a value of a reference state
FIG. 74 A flow chart illustrating the method to recursively obtain frequency distribution using steering angle estimation error data
FIG. 75 A control diagram showing the driving assistance system for vehicle according to a twelfth embodiment of the present invention
FIG. 76 A flow chart illustrating the processing procedure of the driving assistance control program achieved in the twelfth embodiment
FIG. 77 A flow chart illustrating the calculation processing procedure of accelerator pedal position entropy
FIG. 78 An example of categories of long-duration accelerator pedal position entropy calculation results
FIG. 79 An example of relationship between long-duration accelerator pedal position entropy categories and contents to be informed
FIG. 80 A flow chart illustrating the processing procedure of the driving assistance control program achieved in the variation 1 of the twelfth embodiment
FIG. 81 A flow chart illustrating the processing procedure of the driving assistance control program achieved in the variation 1 of the twelfth embodiment
FIG. 82 A flow chart illustrating the calculation method of .alpha.ap value of a reference state
FIG. 83 An example of categories of intermediate-duration accelerator pedal position entropy calculation results
FIG. 84 An example of relationship between intermediate-duration accelerator pedal position entropy categories and contents to be informed
FIG. 85 An example of categories of comparison results of a previous intermediate-duration accelerator pedal position entropy and a measured intermediate-duration accelerator pedal position entropy
FIG. 86 An example of relationship between categories of comparison results of a previous intermediate-duration accelerator pedal position entropy and a measured intermediate-duration accelerator pedal position entropy and contents to be informed
FIG. 87 An example of categories of accelerator pedal position error distribution a value calculation results
FIG. 88 An example of relationship between accelerator pedal position error distribution a value categories and contents to be informed
FIG. 89 A flow chart illustrating the processing procedure of the driving assistance control program achieved in the variation 2 of the twelfth embodiment
FIG. 90 An example of categories of short-duration accelerator pedal position entropy calculation results
FIG. 91 An example of relationship between short-duration accelerator pedal position entropy categories and contents to be informed
FIG. 92 A control diagram showing the driving assistance system for vehicle according to a thirteenth embodiment of the present invention
FIG. 93 A table presenting the relationship between individual indices and detection targets for drive diagnosis
FIG. 94 A flow chart illustrating the processing procedure of the driving assistance control program achieved in the thirteenth embodiment
Explanation of reference numerals
8: steering angle sensor 10: laser radar 15: front camera 30: vehicle speed sensor 35: acceleration sensor 50: navigation system 55: accelerator pedal position sensor 60: brake pedal stroke sensor 65: turn signal switch 100, 200, 250, 300, 350, 400, and 500: controllers 130: speaker 180: display unit
Best mode for carrying out the invention
First Embodiment
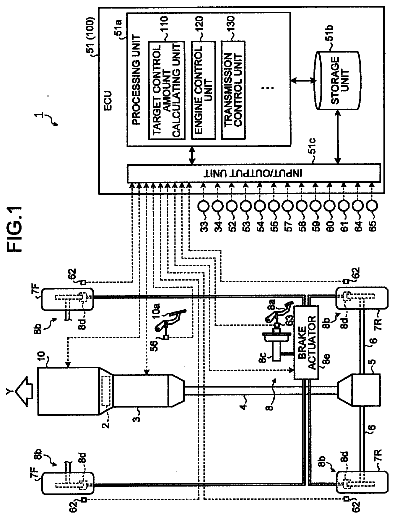
A driving assistance system for vehicle according to the first embodiment of the present invention will be now explained. FIG. 1 is a control diagram showing a driving assistance system 4 for vehicle according to the first embodiment. FIG. 2 is a view illustrating how the driving assistance system 4 for vehicle is arranged on an automobile.
At first, the structure of the driving assistance system 4 for vehicle will now be explained.
A laser radar 10, mounted to a front grille, bumper, or the like of the vehicle, propagates infrared light pulses horizontally so as to scan the region ahead of the vehicle. The laser radar 10 measures the reflected radiation of the infrared light pulses having been reflected by a plurality of obstacles ahead (usually, the rear end of a leading vehicle) and detects a vehicle separation or a distance to the plurality of obstacles and a relative velocity from arrival time of the reflected radiation. The detected vehicle separation and the relative velocity are output to a controller 300. The region ahead of the vehicle scanned by the laser radar 10 is approximately .+-.6 deg to each side of an axis parallel to the vehicle longitudinal centerline, and the objects existing in the range are detected.
A vehicle speed sensor 30 measures the number of wheel revolutions or the number of revolutions of the output side of the transmission so as to detect the vehicle speed of the vehicle, and outputs the detected speed thereof to the controller 300.
A navigation system 50, including a GPS (Global Positioning System) receiver, a map database, a display monitor, and the like, is a system to perform a path search, a routing assistance, and the like. Based on current location of the vehicle obtained via the GPS receiver and road information stored in the map database, the navigation system 50 obtains information on the class, the width, and the like of the road along which the vehicle travels.
An accelerator pedal stroke sensor 55 detects stroke amount of the accelerator pedal (accelerator pedal operation amount), for instance, having been converted to angle of rotation of servomotor through a link mechanism and outputs it to the controller 300. The brake pedal stroke sensor 60 detects the depression amount of the brake pedal by the driver (degree of operation of the brake pedal). The brake pedal stroke sensor 60 outputs the detected brake pedal operation amount to the controller 300. A turn signal switch 65 detects whether or not the driver has operated a turn signal lever and outputs a detection signal to the controller 300.
The controller 300, which is an electronic control unit constituted by a CPU and CPU peripheral components such as a ROM and a RAM, controls the overall driving assistance system 4 for vehicle. Based on signals received from the laser radar 10, the vehicle speed sensor 30, the navigation system 50, the accelerator pedal stroke sensor 55, the brake pedal stroke sensor 60, the turn signal switch 65, and the like, the controller 300 analyzes driving characteristics of the driver and carries out drive diagnosis. Then, based on the drive diagnosis result, the controller 300 provides the driver with information. Information provided to the driver includes alarm to the driver, improvement suggestion of the drive operation, and the like. Control contents of the controller 300 are described in detail later.
A speaker 130 is used to provide the driver with information in a beep sound or in a voice, in response to a signal from the controller 300. A display unit 180 is used to display an alarm or improvement suggestion to operation of the driver, in response to a signal from the controller 300. For example, the display monitor of the navigation system 50, a combination meter, and the like can be used as the display unit 180.
Next, the behavior of the driving assistance system 4 for vehicle according to the first embodiment will be explained, beginning with the outline thereof.
Based on traveling conditions of the vehicle and drive operation of the driver, the controller 300 carries out drive diagnosis of the driver, and, in response to the drive diagnosis result, alerts the driver and suggests the driver to improve the drive operation. More specifically, the controller 300 detects driving characteristics when the driver lifts his foot off the accelerator pedal in a state where the vehicle is following the leading vehicle, and carries out drive diagnosis using the detected driving characteristics as an index. Then, if the drive diagnosis result indicates that the driver is engaging in risky driving more than he usually is, i.e., if the drive operation of the driver is deviated into a riskier state, the controller 300 alerts the driver so as to inform the driver thereof before the drive operation of the driver goes into a high-risk state. On the other hand, if the drive diagnosis result indicates that the drive operation of the driver is better than the standard of general public, the controller 300 provides the driver with information so as to encourage safer driving or suggest improvement.
Thus, the driving assistance system 4 for vehicle achieved in the first embodiment includes three functions, i.e., a function to detect the drive operation of the driver by drive diagnosis, a function to alert the driver in response to the detected result, and a function to give an improvement suggestion to the driver in response to the detected result. Accordingly, the driving assistance system 4 for vehicle allows and encourages the driver to see his own driving characteristics objectively, and provides the driver with an advice depending upon the driving characteristics so that the driver can learn a driving method to reduce the risk. In the first embodiment, drive diagnosis is carried out in particular with respect to longitudinal drive operation of the driver.
The behavior of the driving assistance system 4 for vehicle according to the first embodiment will be explained in detail with reference to FIG. 3. FIG. 3 is a flow chart illustrating the procedure of driving assistance control processing performed by the controller 300 achieved in the first embodiment. The processing is performed continuously at regular intervals, e.g., for every 50 msec.
At first, traveling conditions of the vehicle are detected in step S100. Here, as the traveling conditions of the vehicle, the controller 300 obtains velocity V of the vehicle detected by the vehicle speed sensor 30, and vehicle separation D and relative vehicle velocity Vr between the vehicle and the leading vehicle detected by the laser radar 10. Operating states of the driver are detected in step S102. Here, as the operating states of the driver, the controller 300 obtains accelerator pedal operation amount detected by the accelerator pedal stroke sensor 55, brake pedal operation amount detected by the brake pedal stroke sensor 60, and whether or not the turn signal lever has been operated detected by the turn signal switch 65.
In step S104, in order to determine traffic scene of the vehicle described later, the controller 300 calculates time to contact TTC and time headway THW between the vehicle and the leading vehicle. Time to contact TTC is a physical quantity representing a current degree of closeness of the vehicle to the leading vehicle. Time to contact TTC indicates the number of seconds before the vehicle separation D becomes zero and the vehicle and the leading vehicle contact with each other if the current traveling condition remains, i.e., if the velocity V of the vehicle and the relative vehicle velocity Vr are constant. Time to contact TTC is expressed by the following equation (1). TTC=D/Vr (Equation 1)
Time headway THW is a physical quantity representing a degree of influence on time to contact TTC by a predicted future change in velocity of the leading vehicle when the vehicle is following the leading vehicle, i.e., a degree of influence on the assumption that the relative vehicle velocity Vr changes. Time headway THW, which is the quotient of vehicle separation D divided by the velocity V of the vehicle, represents time until the vehicle reaches the current position of the leading vehicle. Time headway THW is expressed by the following equation (2). THW=D/V (Equation 2)
In step S106, a decision is made as to whether or not an accelerator pedal off operation has been performed. For example, if the controller 300 detects that the current accelerator pedal operation amount detected in step S102 becomes substantially zero and the accelerator pedal is released from a state in which the accelerator pedal is depressed, the flow of control proceeds to step S110. If the accelerator pedal is depressed, the controller 300 terminates the processing. It is to be noted that in the explanations given below, an operation of releasing the accelerator pedal which has been depressed is referred to as the accelerator pedal off operation, and a point of time at which the accelerator pedal is released is referred to as the accelerator pedal off time.
In step S110, the traffic scene of the vehicle is determined. The accuracy of drive diagnosis is improved by limiting conditions to vehicle traveling conditions and operating states of the driver, and, in order to reduce discomfort to the driver when information is provided to the driver in response to the drive diagnosis result, traffic scene of the vehicle is determined so that drive diagnosis is carried out solely in a particular traffic scene. More specifically, drive diagnosis is carried out exclusively in a traffic scene in which the accelerator pedal is released from a state in which the vehicle is stably following the same leading vehicle.
Examples of conditions of stable follow-up travel scenes are as follows.
(a) The vehicle is following the same leading vehicle (For example, the difference between the current vehicle separation and the previously measured vehicle separation is less than 4 meters)
(b) The vehicle is not approaching rapidly (For example, time to contact TTC is more than 10 seconds)
(c) Time headway THW is equal to or less than a predetermined value (For example, time headway THW is less than four seconds)
(d) There is no brake operation performed by the driver (For example, the brake pedal operation amount is substantially zero)
(e) There is no turn signal lever operation performed by the driver (For example, there is no ON signal received from the turn signal switch 65)
(f) The above states (a) to (e) remain (For example, for five seconds or more)
When the conditions (a) to (f) are all satisfied, the controller 300 determines that the traffic scene of the vehicle is a stable follow-up travel scene, and the flow of control proceeds to step S112 for the controller 300 to carry out drive diagnosis. On the other hand, in the case where any of the conditions (a) to (f) is not satisfied, the controller 300 determines that the traffic scene of the vehicle does not correspond to a particular traffic scene, does not carry out drive diagnosis, and terminates the processing. It is to be noted that conditions in which the controller 300 determines whether or not the traffic scene of the vehicle is a stable follow-up travel scene are not limited to the above conditions (a) to (f). In addition, another detection means may detect whether or not the brake has been operated and whether or not the turn signal lever has been operated.
In step S112, the controller 300 determines travel location. More specifically, based on database, the controller 300 labels index numbers to link IDs described in map information of the navigation system 50. A link ID is an ID assigned to a link that connects together nodes, which are attribution change points at which lane attribution is changed. Each link has data of lane category, link length (distance between nodes), and so on. In step S114, the controller 300 records the present time.
In step S116, based on the labeling results in steps S112 and S114, the controller 300 stores data used to carry out drive diagnosis of the driver. Here, for example, the present time, i.e., the time at which the vehicle traveled in the link, the travel distance, a driving characteristic index in the link, the number of travels in the link, and the like are written in the structure for each link ID so as to create traffic road database. In the first embodiment, time to contact TTC when the accelerator pedal is released is used as a physical quantity that represents driving characteristics of the driver. Calculation methods of the driving characteristics and the driving characteristic index will be explained in detail in drive diagnosis processing.
In the following step S120, the data stored in step S116 are used to carry out drive diagnosis of the driver. Drive diagnosis is carried out based on driving characteristics of the driver when the accelerator pedal is released from a state in which the vehicle is stably following the leading vehicle. Driving characteristics when the vehicle is following the leading vehicle include, for instance, time headway THW of the vehicle and the leading vehicle, inverse of time headway THW, time to contact TTC of the vehicle and the leading vehicle, vehicle separation, inverse of vehicle separation, and so on. In the first embodiment, a case in which time to contact TTC at the point of time when the accelerator pedal is released is used is explained as an example.
It is to be noted that time to contact TTC when the accelerator pedal is released is robustly calculated using a filter of the longitudinal direction from data of the vehicle separation D and the relative vehicle velocity Vr before and after the point of time of the accelerator pedal off operation.
FIG. 4 illustrates the data structure of the driving assistance system 4 for vehicle. A layer A represents the amount of data of relatively short-duration "this moment", which indicates the current operating condition of the driver. A layer B represents the amount of data of "this day", indicating the operating condition of the day of the driver, which is longer than "this moment". A layer C represents the amount of data of "usual" indicating the usual operating condition of the driver, which is longer than "this day", i.e., personal characteristics. A layer D represents the amount of data of driving characteristics of "general public", which is used to compare operation of each driver with that of general driver and to diagnose the operation of each driver.
A lower layer has a larger amount of data. The amount of data included in each of the layers corresponds to the number of samples used to calculate the mean values of time headway THW in "this moment", "this day", and "usual". The data structure shown in FIG. 4 is achieved by varying the number of the samples. The values of data included in each of the layers are continually updated by real-time calculations explained below.
In drive diagnosis processing, the controller 300 uses the data of each of the layer A to the layer D so as to detect operation of the driver in different time spans, i.e., in "this moment", "this day", and "usual". The drive diagnosis processing executed in step S120 will, be explained in detail with reference to the flow chart of FIG. 5.
In step S122, a driving characteristic value of the driver of "this moment" is calculated so as to carry out drive diagnosis of "this moment" of the driver. As driving characteristic values of the driver, the controller 300 calculates the mean value Mean_x(n) and the standard deviation Stdev_x(n) of time to contact TTC at the accelerator pedal off time in a predetermined period of time that defines "this moment". Here, the predetermined period of time that defines "this moment" is, for example, 60 seconds, and, the mean value Mean_x(n) and the standard deviation Stdev_x(n) of time headway THW are calculated using data for 60 seconds from the past to the present detected at the accelerator pedal off time in the stable follow-up travel scene determined in step S110. The mean value Mean_x(n) and the standard deviation Stdev_x(n) are calculated using the following parameters.
x(n): Data obtained at this time, i.e., time to contact TTC at the accelerator pedal off time calculated in step S106
K: The number of data of TTC calculated in a predetermined period of time
M.sub.1(n): The sum of TTC in a predetermined period of time to be calculated this time
M.sub.2(n): The sum of squares of TTC in a predetermined period of time to be calculated this time
M.sub.1(n-1): The sum of TTC in a predetermined period of time calculated in the previous time
M.sub.2(n-1): The sum of squares of TTC in a predetermined period of time calculated in the previous time
Mean_x(n): The mean value of the data of this time, i.e., the mean value of TTC
Var_x(n): The variance of the data of this time, i.e., the variance of TTC
Stdev_x(n): The standard deviation of the data of this time, i.e., the standard deviation of TTC
Here, the number of data K is determined by the product of a predetermined period of time multiplied by the number of samplings per second. For instance, when the predetermined time for "this moment" is 60 seconds and the number of samplings is 5 Hz, the number of data K=300.
The sum M.sub.1(n) and the sum of squares M.sub.2(n) are each calculated using the following equations
and
with these parameters. M.sub.1(n)=M.sub.1(n-1)+x(n)-M.sub.1(n-1)/K (Equation 3) M.sub.2(n)=M.sub.2(n-1)+(x(n)).sup.2-M.sub.2(n-1)/K (Equation 4)
The mean value Mean_x(n), the variance Var_x(n), and the standard deviation Stdev_x(n) of time to contact TTC at the accelerator pedal off time at "this moment" are calculated using the following equations (5), (6), and (7), respectively. Mean.sub.--x(n)=M.sub.1(n)/K (Equation 5) Var.sub.--x(n)=M.sub.2(n)/K-(M.sub.1(n)).sup.2/K.sup.2 (Equation 6) Stdev.sub.--x(n)= (Var.sub.--x(n)) (Equation 7)
In step S124, in order to carry out drive diagnosis of "this day" of the driver, the controller 300 calculates follow-up characteristic values of the driver of "this day", i.e., the mean value Mean_x(n) and the standard deviation Stdev_x(n) of time to contact TTC at the accelerator pedal off time in a predetermined period of time which defines "this day". Here, the predetermined period of time that defines "this day" is, for instance, 360 seconds, and the mean value Mean_x(n) and the standard deviation Stdev_x(n) of time to contact TTC at the accelerator pedal off time are calculated using data for 360 seconds from the past to the present detected at the accelerator pedal off time in the stable follow-up travel scene determined in step S110.
More specifically, as is the case with "this moment", the equations
and
are used to calculate the mean value Mean_x(n) and the standard deviation Stdev_x(n). Here, the number of data K=1800, where the predetermined time for "this day" is 360 seconds and the number of samplings is 5 Hz.
In step S126, in order to carry out drive diagnosis of "usual" of the driver, the controller 300 calculates follow-up characteristic values of the driver of "usual", i.e., the mean value Mean_x(n) and the standard deviation Stdev_x(n) of time to contact TTC at the accelerator pedal off time in a predetermined period of time which defines "usual". Here, a predetermined period of time that defines "usual" is, for instance, 2160 seconds, and the mean value Mean_x(n) and the standard deviation Stdev_x(n) of time to contact TTC at the accelerator pedal off time are calculated using data for 2160 seconds from the past to the present detected at the accelerator pedal off time in the stable follow-up travel scene determined in step S110.
More specifically, as is the case with "this moment", the equations
and
are used to calculate the mean value Mean_x(n) and the standard deviation Stdev_x(n). Here, the number of data K=10800, where the predetermined time for "usual" is 2160 seconds and the number of samplings is 5 Hz.
In processing after the following step S128, drive diagnosis of the driver is carried out using the driving characteristic values calculated in steps S122, S124, and S126. Here, the driving characteristics of the driver based on data obtained in different time spans are each compared so as to diagnose the drive operation of the driver based on how much both of the driving characteristics deviate. In other words, in the data structure shown in FIG. 4, an upper layer (e.g., the layer A) is compared with a lower layer (e.g., the layer B) so as to carry out the drive diagnosis.
At first, in step S128, the controller 300 calculates the degree of deviation that indicates how much the follow-up characteristics of the driver of "this moment" deviate from those of "this day". Here, the degree of deviation of "this moment" relative to "this day" indicates the difference between the distribution of time to contact TTC at the accelerator pedal off time of "this day" and that of "this moment". In order to calculate the degree of deviation of "this moment" relative to "this day", the distribution of time to contact TTC at the accelerator pedal off time of "this day" is used as a reference distribution which represents a long-duration action distribution, and the distribution of time to contact TTC at the accelerator pedal off time of "this moment" is used as a distribution of comparison target which represents a short-duration action distribution.
As a calculation method of degree of deviation, a method in which distribution functions of short-duration (e.g., "this moment") and long-duration (e.g., "this day") are compared at a position (referred to as a comparison value x.sub.std) of "mean value minus standard deviation" of the action distribution of long-duration (e.g., "this day") is adopted.
For calculating degree of deviation, the mean value Mean_x(n) and the standard deviation Stdev_x(n) of time to contact TTC at the accelerator pedal off time calculated in steps S122 and S124 are used to calculate a probability density function on the assumption that time to contact TTC at the accelerator pedal off time is normally-distributed.
As FIGS. 6(a) and (b) show, the controller 300 calculates degree of deviation Dist.sub.diff, which indicates how much the short-duration normal distribution of comparison target deviates from the reference long-duration normal distribution, in the region of comparison target that is set based on a predetermined value (comparison value x.sub.std). More specifically, the difference (area of the hatched region in FIG. 6(a) and the length of the arrow in FIG. 6(b)) between comparison distribution and reference distribution in the region where time to contact TTC is shorter than the comparison value x.sub.std corresponds to the degree of deviation Dist.sub.diff. Calculation methods shown in FIGS. 6(c) and (d) will be described later.
FIGS. 7(a) and (b) show probability density distribution and cumulative distribution calculated based on the results obtained through actual experiments on the public roads. In FIG. 7(a), probability density distribution of time to contact TTC at the accelerator pedal off time approximated by normal distribution is shown in dashed-dotted line using the mean value Mean_x(n) and the standard deviation Stdev_x(n) of "this moment", and probability density distribution of time to contact TTC at the accelerator pedal off time approximated by normal distribution is shown in solid line using the mean value Mean_x(n) and the standard deviation Stdev_x(n) of "this day". In FIG. 7(b), cumulative distribution of "this moment" is shown in dashed-dotted line, and that of "this day" is shown in solid line. In FIGS. 7(a) and (b), the mean value Mean_x(n) of time to contact TTC at the accelerator pedal off time of "this moment"=1.22, the standard deviation Stdev_x(n) thereof=0.80, the mean value Mean_x(n) of time to contact TTC at the accelerator pedal off time of "this day"=1.63, and the standard deviation Stdev_x(n) thereof=1.00.
At first, the comparison value x.sub.std is calculated using the following equation
from mean value Mean_std and standard deviation Stdev_std of reference distribution. x.sub.std=Mean_std-Stdev_std (Equation 8)
The comparison value x.sub.std is a value of time to contact TTC that indicates the point in which reference distribution and comparison distribution are compared, which corresponds to the positions shown in dashed line in FIGS. 7(a) and (b).
Next, the value of cumulative distribution at the comparison value x.sub.std of reference distribution is calculated. A probability density function f(x) of normal distribution is calculated using the following equation (9), where the mean value is denoted by .mu. and the standard deviation is denoted by a (refer to FIG. 7(a)).
.function..sigma..times..times..pi..times.e.mu..times..sigma..times..time- s. ##EQU00001##
The probability density function f(x) calculated using equation
is integrated to give a cumulative distribution function F(x) as expressed in the following equation
(refer to FIG. 7(b)).
.function..intg..sigma..times..times..pi..times.e.mu..times..sigma..times- .d.times..times. ##EQU00002##
Probability F.sub.std(x) of cumulative distribution in comparison value x.sub.std is calculated using the following equation (11), where the mean value of the reference distribution is denoted by .mu..sub.std and the standard deviation thereof is denoted by .sigma..sub.std.
.function..intg..sigma..times..times..pi..times.e.mu..times..sigma..times- .d.times..times. ##EQU00003##
Next, the value of cumulative distribution in the comparison value x.sub.std of comparison distribution is calculated. A probability F.sub.comp(x) of cumulative distribution in comparison value x.sub.std is calculated using the following equation (12), where the mean value of the comparison distribution is denoted by .mu..sub.comp and the standard deviation thereof is denoted by .sigma..sub.comp.
.function..intg..sigma..times..times..pi..times.e.mu..times..sigma..times- .d.times..times. ##EQU00004##
The description continues in the full USPTO document.
 Lapsed, fee not paid2 drawings