Technical field
This invention is called TORQ--the Transferable Occupation Relationship Quotient. TORQ is a mathematical manipulation of Labor Market Information (LMI) and other data, making use of publicly and privately available databases of key data about workers and occupations in the United States. It responds to a pervasive and continual need among economic developers, workforce development professionals, educators, and others for a useful way to assess the feasibility of transferring from one occupation to another. This invention's method for achieving this measure of "transferability" is based on mathematical relationships, including, but not limited to, statistical correlation of the skills, abilities, knowledge, and other attributes that are vital to each occupation.
Background art
Characterizing and comparing the vital attributes of occupations has been an important part of the field of labor economics for many years. During the past decade, two major databases of occupational information have become the most widely known and used sources of occupation profiles and attribute comparison. Following are detailed descriptions of these two databases, which in turn are key information sources of TORQ, the invention described in this application. Additionally, several other systematic attempts have been made to approach the concept of occupational comparison and job transfer. The most significant of those efforts are described here.
O*net
O*NET.TM. refers to the U.S. Department of Labor's Occupational Information Network. O*NET's taxonomy of occupations is an extension of the occupation labels developed by the Bureau of Labor Statistics' Standard Occupational Classification (SOC) system.
For example, as of late 2008, O*NET's database provided detailed data on 809 separate officially defined occupations. Each of these occupations is associated with a set of descriptors according to the O*NET Content Model, derived from detailed observation and analysis of job characteristics of each described occupation. O*NET's database is periodically reviewed and updated to include information on new and emerging occupations. The current version, as of late 2011, is O*NET 16.
The O*NET Content Model includes all six of the domains listed below, together with all of the descriptors there under which are associated with each of O*NET's listed occupations: Worker Characteristics--enduring characteristics that may influence both work performance and the capacity to acquire knowledge and skills required for effective work performance. Abilities--Enduring attributes of the individual that influence performance. Occupational Interests--Preferences for work environments. Occupational Interest Profiles (OIPs) are compatible with Holland's (1985, 1997) model of personality types and work environments. Work Values--Global aspects of work composed of specific needs that are important to a person's satisfaction. Occupational Reinforcer Patterns (ORPs) are based on the Theory of Work Adjustment (Dawis & Lofquist, 1984). Work Styles--Personal characteristics that can affect how well someone performs a job. Worker Requirements--descriptors referring to work-related attributes acquired and/or developed through experience and education. Basic Skills--Developed capacities that facilitate learning or the more rapid acquisition of knowledge Cross-Functional Skills--Developed capacities that facilitate performance of activities that occur across jobs. Knowledge--Organized sets of principles and facts applying in general domains. Education--Prior educational experience required to perform in a job. Experience Requirements--requirements related to previous work activities and explicitly linked to certain types of work activities. Experience and Training--If someone were being hired to perform this job, how much of the following would be required? Basic Skills--Entry Requirement--Entry requirement for developed capacities that facilitate learning or the more rapid acquisition of knowledge. Cross-Functional Skills--Entry Requirement--Entry requirement for developed capacities that facilitate performance of activities that occur across jobs. Licensing--Licenses, certificates, or registrations that are awarded to show that a job holder has gained certain skills. This includes requirements for obtaining these credentials, and the organization or agency requiring their possession. Occupation-Specific Information--variables or other Content Model elements of selected or specific occupations. Tasks--Occupation-Specific Tasks. Tools and Technology--Machines, equipment, tools, software, and information technology workers may use for optimal functioning in a high performance workplace. Labor Market Characteristics--variables that define and describe the general characteristics of occupations that may influence occupational requirements. Labor Market Information--Information related to economic conditions and labor force characteristics of occupations. Occupational Outlook--Projections of future economic conditions and labor force characteristics of occupations. Occupational Requirements--a comprehensive set of variables or detailed elements that describe what various occupations require. Generalized Work Activities--General types of job behaviors occurring on multiple jobs. Detailed Work Activities--Detailed types of job behaviors occurring on multiple jobs. Organizational Context--Characteristics of the organization that influence how people do their work. Work Context--Physical and social factors that influence the nature of work.
The information O*NET provides about each occupation is exhaustive and comprehensive. The multiple dimensions of occupational attributes cataloged by O*NET make the description of each occupation both extremely rich and highly complex. A table listing the major and minor components of the O*NET database and their hierarchical relationships is presented in FIG. 3.
Researchers attempting to make use of the O*NET database have been accordingly limited in their ability to embrace the entire set of data in several kinds of studies involving career transfer and career paths. Most efforts to make productive use of the O*NET database have only encompassed one or a few dimensions of O*NET occupational data, or have merely repackaged O*NET data verbatim within various graphic and/or tabular displays or reports.
Workkeys.rtm.
Another database of Skills and Abilities by occupation is provided by ACT, Inc. and which is known as WORKKEYS.RTM.. WORKKEYS provides a more concise set of groupings of Skills and Abilities--eight
groupings in all. Each of these categories--e.g. Applied Mathematics or Locating Information--is rated on a 0-7 scale. Like O*NET's occupational attributes, the information supplied by WORKKEYS is derived from a system of job profiling based on detailed observation and interviewing.
The major advantage of WORKKEYS is that it also features a worker assessment component, whereby individuals take tests to determine their personal skill levels in each of the crucial WORKKEYS dimensions. This component is highly useful to business recruiters and workforce and human resource professionals wishing to match individuals to job opportunities. The combination of career-to-career comparison and individual-to-career comparison has made WORKKEYS a preferred database for occupational information among the world of workforce development, despite the relative thinness of its occupational information compared to O*NET.
Transferable Skills and Gap Analysis
The concept of "transferable skills" has been the subject of a great deal of research and exploration among labor economists as well as among workforce and economic developers. From the workforce development standpoint, evaluating transferable skills has long been the concern of those tasked with finding new employment opportunities for displaced workers, whether individually or in the case of a mass layoff or plant closing. For economic developers, quickly assessing transferable skills present in a region's workforce is important to efforts to recruit and retain businesses.
Additionally, the interests of workforce development would be well served by a reliable method for assessing the skills present in a region's workforce. Much has been made lately of the importance of "skills gap analysis" as a tool for assessing the condition of local workforces, and preparing a region's workforce for 21.sup.st-century economy occupations. Most such efforts, however, have found that, while estimating shortages for individual occupations is relatively easy, given plentiful public employment information, it is much more difficult to assess the skills of an area's labor force in a similar way, absent an exhaustive community survey or other such expensive measures.
Career Ladders, Lattices, and Pathways
Related to the idea of skills transfer is the construction of networks that are variously known as career ladders, lattices, and/or pathways. These models of the interconnections between careers in similar fields or requiring similar Skill/Ability/Knowledge sets are designed for and used by guidance and employment counselors and human resources professionals to illustrate the possibilities offered by particular career and/or educational choices.
The various labels for these career maps imply different approaches to the network of career relationships. A career ladder indicates a more or less linear progression of education and experience in jobs of similar natures in the same or similar industries. A career lattice is a more inclusive set of occupations, based on relationships of skills, education levels, abilities, earnings, industries, and many other bases of comparison. A career path or pathway, then, describes any set of interconnected occupations within this larger career lattice.
It has historically been more difficult to construct a career lattice than a career ladder. The career path from a Certified Nursing Assistant to a Registered Nurse is relatively straightforward, but finding occupations with comparable attributes that might supply a need for skilled warehouse workers may be more difficult. Efforts to create career lattices based on observed O*NET or WORKKEYS attributes have been attempted, but none so far has taken a comprehensive view of these attributes with statistical rigor and precision that embraces the entire data set represented by either of these databases.
Competency Modeling
A close relative to the notion of career ladders and pathways is a product called a "competency model." A U.S. Department of Labor-sponsored project called the "Competency Model Clearinghouse" has produced such models based on the Abilities, Skills, and Knowledge requirements of general employment in broad industry sectors and/or clusters, such as Information Technology, Advanced Manufacturing, and others.
These "competency models" consist of pyramidal representations of the varieties of Abilities, Skills, and Knowledge that are required for any occupation within a given industry sector or cluster. The bottom level of the pyramid contains the most basic "employability" attributes like "interpersonal skills" and "initiative." Subsequent levels attain more and more specificity to the given industry, examining common knowledge bases required of all Information Technology professionals, for example. In the upper levels of these competency models, occupation-specific job requirements are quoted directly from O*NET.
These competency models do employ a systematic approach to their construction and definition, consisting of consultation with employers within the given industry for which the model has been constructed. This application, however, is by its nature more useful in a broader strategic sense than at the level of individual occupations. At the occupational level, competency models yield no more specific information than does raw O*NET data.
Brief description of the drawings
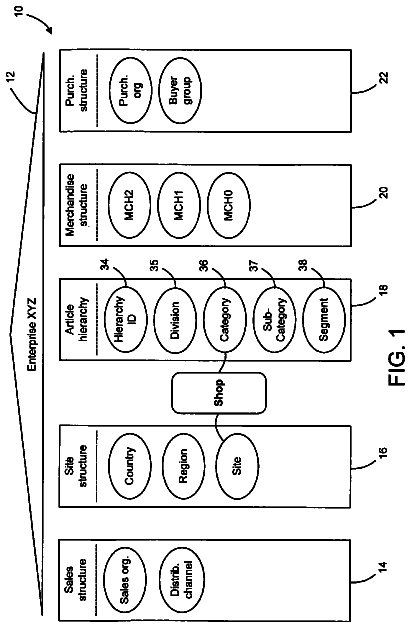
FIG. 1 is a flowchart describing the process by which data are obtained and transformed to compute and store values for the Transferable Occupation Relationship Quotient;
FIG. 2 is a flowchart describing the process of end user interface to retrieve information derived from the Transferable Occupation Relationship Quotient;
FIG. 3 is a detailed table listing the various dimensions of the Department of Labor's O*NET occupational database used to calculate the Transferable Occupation Relationship Quotient;
FIG. 4 is the percent of the original LV that has decayed after the passage of T years which are measured along the X axis;
FIG. 5 is the percent of the decayed value of LV that will be "restored" by the algorithm after the passage of V years on the job which are measured along the X axis; and
FIG. 6 is the numbers for L.sub.l.sup.o for the first five occupations in O*NET 16;
FIG. 7 is a gap analysis graph; and
FIG. 8 is a flowchart describing the Rapid Job Profiling Tool.
Disclosure of the invention
TORQ begins with the statistical principle of correlation, i.e. "a single number that describes the degree of relationship between two variables." TORQ computations can be performed by means of a computer, software and a database where necessary.
Mathematically, a correlation is computed according to the following formula derived from the Web Center for Social Research Methods, where x and y are the two variables in question:
.function..times..mu..times..mu..times..mu..times..times..mu. ##EQU00001## The ratio (Correl(X,Y)) produced by this formula is known as a correlation coefficient.
By applying this computation to the complete set of scores--that is, O*NET and WORKKEYS values for element "Levels" and "Importance" of Skills, Abilities, Knowledge, and all other attributes relevant to any two given occupations within the database, the first building block of the TORQ computation is obtained. The multiple dimensions of attribute values in the O*NET and WORKKEYS database (for example; Skills, Abilities, and Knowledge in O*NET or Applied Mathematics and Locating Information in WORKKEYS) each produce their own individual correlation coefficient. The resultant values produced by the correlation algorithm are normalized to a scale of 0 to 100.
Once the correlation coefficients are computed, the process of TORQ calculation continues with an adjustment step which incorporates measures of the individual gaps between all of the composite Level-Importance scores of the Abilities, Skills, and Knowledge attributes (or, as they are termed in O*NET the "elements") for the pair of occupations being analyzed for which those scores for the destination occupation exceeds those for the source occupation. This aggregate measure is then used to adjust the previously calculated correlation coefficients in order to provide a more precise indication of the relationship between occupations and to create an accurate representation of the asymmetry of transfer between occupations.
The adjusted TORQ scores still take values from 0 to 100. A zero value indicates no significant congruence or lack thereof between occupations' Skills, Abilities, and/or Knowledge; and a value of 100 indicates total congruence. (Obviously, each occupation has a TORQ value of 100 relative to itself for all descriptors.)
It should be noted that TORQ values are calculated for each significant descriptor of occupational attributes being compared, i.e., for Abilities, Skills, Knowledge, etc. There is also a combined measure known as a "Grand TORQ," which is obtained by taking a weighted average of all the TORQ values for all the individual descriptor categories measured. "Weighted average" indicates that the calculation of the Grand TORQ can be adjusted to reflect the user's sense of priorities concerning the attributes of each pair of occupations, based on a combination of the correlation coefficients described above.
The full articulation of the mathematical process of calculating TORQ follows below.
Detailed description of the drawings
The following detailed account describes the procedural steps involved in calculating TORQ and user extraction of information from the TORQ database.
Computation and Creation of the TORQ Database (FIG. 1)
101. Acquire O*NET Data for Each Occupation
The process begins with the acquisition of current occupational profile data from the Department of Labor's online O*NET database (or WORKKEYS or a comparable substitute should O*NET data become unavailable at some point).
102. Load complete Set of O*NET Data for Each Occupation into Database
These data are then loaded into a database management program for further manipulation. The current database type for TORQ uses the Structured Query Language (SQL). Each occupation in this database is re-indexed according to a simple set of Occupation Numbers (OCCNOs).
103. Select Attribute Dimensions for Entry into TORQ Calculation Matrices
Each occupational descriptor (e.g. Skills) is selected individually, and scores for both Level and Importance for each element within the given descriptor (e.g. "Active Listening" within Skills) are entered. The current active descriptors for TORQ calculation include Abilities, Skills, and Knowledge. Other descriptors may be used to create TORQ calculation matrices as well, in like fashion.
104. Multiply Level and Importance Scores for All Elements in Each Descriptor
Within each descriptor, the product of each element's Importance and Level scores is calculated, creating a "Combined Multiplicative Descriptor" (or CMD") of for each element within the context of each occupation.
105. Create the TORQ Calculation Matrices
In every descriptor (e.g. Skills) a separate calculation matrix is created, which consists of the CMD scores produced by the multiplication in step (4). Each matrix contains the complete set of these composite scores for every occupation in two dimensions, to allow direct comparison of any occupation with any other. Thus, the dimension of a given descriptor matrix is n.times.m where n=the number of occupations in the current version of the O*NET database and m=number of individual elements in the given descriptor dimension.
106. Correlate Scores Across All Pairs of Occupations
Then, for every one of these calculation matrices, the correlation process F1 is applied to produce a correlation coefficient.
107. Normalize Correlation Coefficients
Each resulting correlation coefficient is then normalized to a 0 to 100 scale via a linear or other mathematical transformation. This resulting normalized coefficient is the first primary component of the Transferable Occupation Relationship Quotient (TORQ), but this alone does not comprise the final TORQ value.
108 and 109. Refine TORQ Value Through Systematic Evaluation of Gaps
The adjustment of the final TORQ value incorporates measures of the individual gaps between all of the composite Level-Importance scores of the Abilities, Skills, and Knowledge elements for the pair of occupations being analyzed. For this purpose, a second type of "cross" Composite Muliticative Descriptor is computed which we designate as CMD.sup.TF and which is computed in the following way:
Consider an occupation from which the transfer is to be made and term that the "FROM" occupation. Consider, also, the occupation to which the transfer is to be made and term that the "TO" occupation. The CMD.sup.TF is computed by multiplying the Importance score of the TO occupation times the Level score of the FROM occupation.
For each element, the sum of the differences between the conventional CMD scores for the TO occupation and the CMD.sup.TF relevant to the two occupations. However, this summation is made only in those cases for which the CMD for the TO occupation exceeds that of the CMD.sup.TF. The sum of those differences as so computed is then divided by the sum of CMD for the TO occupation. This aggregate measure (i.e., the ratio produced as just described) is then used to adjust the previously calculated correlation coefficients. This adjustment makes the TORQ value more accurate and useful in at least two important ways: First, it corrects the strictly correlation-based calculation by introducing a quantitative measure of the asymmetry between the transferability between members of pairs of occupations. In the usual case, the measure of the transferability (i.e., the TORQ) of a worker in occupation "A" to occupation "B" is not the same as the TORQ in the opposite direction, i.e., from "B" to "A." The transferability of a paralegal to become a lawyer, for example, is not the same as that of a lawyer transferring to become a paralegal. Taking account of the gaps in the occupational attributes as described above ensures that this asymmetry will be reflected in the TORQ values. (In other words, the TORQ value will not be the same for the paralegal.fwdarw.lawyer transition as it would for the lawyer.fwdarw.paralegal transition.) Second, it accounts for the rare but problematic instances in which the composite Level-Importance scores of two occupations are highly correlated but where large and uniform gaps exist between the two sets of scores. In such cases, a high correlation coefficient taken by itself is a spurious indicator of the actual transferability of workers. If two occupations require similar ASKs (Abilities, Skills, and Knowledge) but there exist consistently large gaps in the scores required between the two across the entire range of ASKs, then a mere correlation coefficient would look similar for these two occupations as it would for two which are genuinely closely related and present a real possibility for transfer. Adjusting the correlation coefficient by applying a measure of the attribute gaps between the two occupations' scores minimizes the possibility that the final TORQ will indicate a spurious degree of transferability. 110. Acquire and Synchronize Related Labor Market Information by Occupation
Separately, other labor market information (LMI) is downloaded and stored, and catalogued by the OCCNO of each occupation, to provide matches for each occupation in the TORQ database. This LMI set includes such indicators as prevailing median wages for occupations, estimates of current and projected future regional employment in each occupation, and a wide variety of other information at the national, state, and region-specific levels.
The scope and variety of LMI included in these datasets is determined partially by the set of end users making use of TORQ, and their geographic areas of interest. Currently TORQ uses LMI databases from the national Occupation and Employment Survey (OES) for detailed current information, and state and local information supplied by clients at those levels for purposes of maximum local relevance and the provision of employment projections for estimates of future occupational change.
111. Create TORQ Master Database
Once calculated, TORQ values for every available pair-wise combination of occupations, along every comparable attribute set (e.g. Abilities, Skills, Knowledge, etc.), are stored in a complete database which also contains the catalogued accompanying LMI values for each OCCNO-listed occupation.
112. Update Calculations and LMI
Periodically, updates are supplied to the data upon which TORQ relies for calculation of TORQ values itself--i.e. new editions of O*NET--and for the labor market information which accompanies the occupations in this database. These data sources are monitored regularly and used to refresh the TORQ database of occupational information whenever the source data are renewed. As of the filing of this patent application, TORQ uses values from O*NET version 15, pending the inventor's review of possible irregularities in the new O*NET version 16 released in 2011. Also, new state and sub-state-level clients supply current, local relevant labor market information to use with their own TORQ operations--supplied through the TORQ online user interface.
End User Retrieval of TORQ Database Information (FIG. 2)
201. End User Interactive Access
An end user accessing the TORQ database interacts with it through a front-end software application. This application currently takes the form of a Web-based interface, customized for use by different types of users, which can access TORQ database information over the Internet via a central server which stores and updates TORQ data.
202. Begin User Loop
This begins the sequence of activity for any analytical exercise within the TORQ interactive system.
203. User Actions Querying TORQ Database
This end user application allows the user to query the TORQ database for TORQ values based on pairs of occupations, and on analysis of the TORQ relationships between one occupation and a number of promising alternatives for transfer, via various major tools and sections of the online TORQ user interface. Users may also adjust the output from the database upon the basis of controls for the sensitivity of data to the user's specified criteria. Different types of users will have access to different sets of data controls, depending on the kinds of labor market information relevant to their interests. (A labor economist, for example, may make use of a wider range of statistical sensitivity controls than a career counselor, and might make use of data tools more relevant to long-term strategic analysis than immediate tactical transfer options.)
204. TORQ System Database Query and Report Generation
After receiving instructions for data retrieval and sensitivity controls, the TORQ database produces a report of TORQ values and all specified LMI for the occupations and other data input by the end user.
205. Display Results of Query and LMI Analysis
This report is displayed on the user's screen, in a format which can be printed, saved, etc. according to the user's preference.
206. User Hard Copy Output Generation
The user may choose to produce a hard copy of the output generated by the TORQ system, which may be done in a variety of ways.
207 and 208. Repeat Analysis and User Logoff
The querying and reporting process can be repeated for as many iterations and variations on analysis as the user prefers before ending the user loop.
Contents of the O*NET Database Used by TORQ (FIG. 3)
This figure describes the major portions of the O*NET spectrum of occupational information and their various subdivisions and data contents:
Domains (301): Describes the "domain" of occupational information to which various sets of attributes belong. (This corresponds with the O*NET list of domains cited above in the "Background Art" section.)
Descriptors (302): This lists the sets of major groupings of occupational attributes within each domain.
Elements (303): Descriptions of the various subdivisions of information within each "Descriptor" group. These include: 303a Major Categories--Number of major divisions of the "Descriptor" group. 303b Minor Categories--Number of subdivisions of the Major Categories. 303c Number--the total number of attributes (or "elements") listed within the "Descriptor" group.
Data Entries (304): Descriptions of the type of data reported by O*NET within each "Descriptor" group. These include: 304a Level--An O*NET-defined "Level" of each attribute measured for the occupation in question. (e.g. the level of night vision required by a truck driver) 304b Importance--The O*NET-defined "Importance" value assigned to each attribute to the occupation in question. (For example, night vision is not very important for an accountant.) 304c Data Value--A data value that exists on its own scale (independent of O*NET's ranking system). (For example, education levels are defined as High School Graduate, BA/BS Degree, etc.)
Notes re: O*NET 12 (305): Pertains to the status of each data component in the developing new release of the O*NET database, which will form the updated and expanded library of information for TORQ computation upon its release. (As previously noted, TORQ is designed to runs on the most recent version of the O*NET database, but is not limited to the O*NET database.) A further distinguishing characteristic of TORQ is that it allows each group of users ("clients") to use databases of its own choice. For example, one client group could prefer that its TORQ results should be computed using O*NET 15 while another would prefer results from O*NET*16.
Articulation of Mathematical TORQ Calculation Process
The full process of mathematical computation of the Transferable Occupation Relationship Quotient is articulated below. This process provides the mathematical basis for component
of FIG. 1, the mathematical correlation process that feeds the initial TORQ computation flow chart.
Definitions of Symbols:
V denotes the sequential number of the most current version of the O*NET database. As explained before, TORQ seeks to use the latest version O*NET. The Examples below use O*NET 12 so the value of V is 12.
Symbols and Definitions for Occupations:
O.sup.v equals the number of occupations for which data are supplied in the v.sup.th version of the O*NET database. Circa late 2007, O.sup.v.ident.O.sup.12.
O.sup.12=801
.sup.OCCNOO.sup.v denotes the occupation with "Occupation Number" (or OCCNO) in O.sup.v and. Its value goes from 1 to O.sup.v.
For example, in O*NET12, the first occupation listed in the database (i.e., OCCNO=1) carries the SOC code of 11-1011.00 which corresponds to "Chief Executives." The last occupation listed in O*NET12 (i.e., OCCNO=801) carries the SOC code of 53-7121.00 which corresponds to "Tank Car, Truck, and Ship Loaders." Symbols and Definitions for Descriptors, Elements and Scores: For every .sup.OCCNOO.sup.v.E-backward.D.sup.v, a set of O*NET descriptors (e.g., "Abilities;" "Skills;" Knowledge;") in the v.sup.th version of the O*NET database. .sup.vM equals the number of O*NET descriptors (e.g., "Abilities;" "Skills;" "Knowledge;") in the v.sup.th version of the O*NET database plus the number of CMDs computed as described below. .sup.12M=24. A complete list of the 21 descriptors in O*NET12 is displayed in FIG. 3, plus three CMDs for Abilities, Skills and Knowledge.
For each descriptor .sup.dD.sup.v.epsilon.D.sup.v, (d=1, 2, . . . , .sup.v,M),.E-backward. a set of elements which represent attributes of that descriptor. For example, for the descriptor called "Abilities" in O*NET12, there exist 52 elements with data for scores beginning with "Oral Comprehension" and continuing with "Written Comprehension," "Oral Expression" and so on for 49 more elements.
For each element in each descriptor, there exists one or more sets S.sup.k consisting of N.sup.k scores where S.sup.kx.sub.i, (i=1, 2, . . . , N.sup.k).
To illustrate, in O*NET12, for each of the elements for Abilities, Skills and Knowledge there exist two sets of scores, one for "Level" and the second for "Importance."
Additionally, by multiplying the values for Level and Importance we obtain a third measure which we term the "Combined Multiplicative Descriptor" or "CMD" for each element.
And therefore, where:
OCCNO=1 which translates to "Chief Executives"
v=12;
d=Abilities;
k=Level
i=1 meaning "Oral Comprehension"
So, x.sub.1.epsilon.S.sup.k is equal to 5.50 which is the Level score for Oral Comprehension for Chief Executives in O*NET12.
Similarly, when k=Importance, we have x.sub.1.epsilon.S.sup.k equal to 4.92 which is the Importance score for Oral Comprehension for Chief Executives in O*NET 12.
Finally, for the "Combined Multiplicative Descriptor" or "CMD" for Oral Comprehension for Chief Executives in O*NET 12, we compute the product of Level times Importance. For the element of Oral Comprehension for Chief Executives in O*NET 12, we obtain value for the CMD as 5.50 times 4.92=27.06.
Finally, as previously noted, for each pair of TO-FROM occupations, we also compute a "cross" composite multicative descriptor which we denote as CMD.sup.TF. The CMD.sup.TF is computed by multiplying the Importance score of the TO occupation times the Level score of the FROM occupation. Note that TORQ correlation analysis employs only the conventional CMD. The CMD.sup.TF is used only in the "gap analysis" previously described.
To illustrate the computation of the CMD.sup.TF consider a contemplated transfer FROM a Funeral Director (O*NET code 11-9061.00) to Chief Executive (O*NET code 11-1011.00). In O*NET 12, the Oral Comprehension Level score for Funeral Director is 3.88 while the Oral Comprehension Importance score for Chief Executive is 4.92. Therefore, the CMD.sup.TF in this case would be 3.88 times 4.92=19.09. Incidentally, the "gap" between the conventional CMD for Chief Executive's Oral Comprehension (i.e., 27.06) and the CMD.sup.TF in this case would be 7.97. That would indicate that Funeral Directors' Oral Comprehension, as viewed through the "eyes" of Chief Executive's Importance comes up considerably short. It is this type of "gap" measure that the TORQ algorithm employs to adjust the correlation coefficients between the conventional CMDs of the two occupations.
Working with Matrices from O*NET in TORQ
Recall that for each element in each descriptor, there exists one or more sets S.sup.k consisting of N.sup.k scores where S.sup.kx.sub.j, (j=1, 2, . . . , N.sup.k). In most cases, there are two such sets for each descriptor (Level and Importance). The number of scores in the O*NET database is very large and TORQ builds two 801.times.801 matrices for each descriptor S.sup.k and for each type of data provided (e.g., Level, Importance, etc.). To illustrate, among the matrices from O*NET12, TORQ builds these: For the Abilities descriptor alone, there are 52 Level scores and 52 Importance Scores. Each of these creates a matrix in the working database of dimension 801.times.52. Each of those contains 42,453 individual scores. For Occupational Interests, there are 6 scores for Level which produces a matrix of dimension 801.times.6 containing 4,806 scores. For Work Values, there are 21 scores for Level which gives a matrix of dimension 801.times.21 containing 16,821 scores. For Work Styles, there are 16 Importance scores which gives a matrix of dimension 801.times.16 containing 12,816 scores. For Basic Skills, there are 10 scores each for Level and Importance which gives two matrices of dimension 801.times.10. Each of these contains 8,010 scores. For Cross-Functional Skills, there are 25 scores each for Level and Importance which gives two matrices of dimension 801.times.25 containing 20,025 scores each. For Knowledge, there are 33 scores each for Level and Importance which gives two matrices of dimension 801.times.33 containing 26,433 scores each. For Abilities, Skills, and Knowledge, the scores for Level and Importance are multiplied to produce three synthetic descriptors called "Combined Multiplicative Descriptors" (or "CMDs") each of which has the same dimensions as the original descriptor. Formula for Computing the Correlation Coefficients
For every descriptor or CMD, .sup.dD.sup.v.epsilon.D.sup.v, let X and Y represent two vectors in a set, S.sup.k, of scores for the x.sup.th and y.sup.th occupations where both x and y run from 1 to O.sup.v (which, for O*NET12 would be from 1 to 801). Then the Correlation Coefficient for that pair [abbreviated Correl(X,Y)] is computed in TORQ as follows:
.function..times..mu..times..mu..times..mu..times..times..mu. ##EQU00002## Where: x.sub.i.epsilon.X and y.sub.i.epsilon.Y, i=1 . . . , N.sup.k and (j=1, 2, . . . , N.sup.k);
.mu..times. ##EQU00003## (i.e., the mean value of the X vector) and
.mu..times. ##EQU00004## (i.e., the mean value of the Y vector).
For each descriptor or CMD, .sup.dD.sup.v.epsilon.D.sup.v, for which scores exist in the current version of the O*NET database (for Level, Importance, or other data value), TORQ computes correlation coefficients as just described for every pair of the O.sup.v occupations. These correlation coefficients may range in value from -1 to +1.
Normalization of the Correlation Coefficients
TORQ "normalizes" each correlation coefficient by multiplying it by 100 (or otherwise linearly transforming it). For each descriptor, therefore, the computation and this normalization produce a square matrix of correlation coefficients of dimension 801.times.801 that is symmetric around its diagonal axis.
For example, if a given user of TORQ based on ONET12 preferred to analyze only the descriptors of Abilities, Skills and Knowledge (rather than the entire gamut of O*NET descriptors) then there would be nine matrices of correlation coefficients, each of dimension of 801.times.801. They would be for the Level and Importance of the three descriptors selected for analysis plus an additional matrix of CMD correlation coefficients corresponding to the original three descriptors. Obviously, the number of matrices of correlation coefficients increases in proportion to the number of descriptors chosen for analysis.
Illustration of TORQ Calculation Based on Existing O*NET Occupational Attributes
To illustrate the procedure described above, consider how the Abilities Importance correlation coefficient is computed for one pair of occupations, namely Cardiovascular Technologists and Technicians (SOC 29-2031.00) and Registered Nurses (29-1111.00).
Step 1: Download the latest O*NET database which, for the purposes of this illustration, is O*NET 12.0 Database and is to be found on the Internet. Store these data in a local database editor and/or spreadsheet program.
Step 2: Retrieve the Abilities Importance and Level Scores for both occupations.
Step 3: Standardize the original Data Value according to the following formula as provided by O*NET.
The Level and Importance scales each have a different range of possible scores. Ratings on Level were collected on a 0-7 scale, ratings on Importance were collected on a 1-5 scale, and ratings on Frequency were collected on a 1-4 scale. To make reports generated by O*NET Online more intuitively understandable to users, descriptor average ratings were standardized to a scale ranging from 0 to 100. The equation for conversion of original ratings to standardized scores is: S=((O-L)/(H-L))*100 where S is the standardized score, O is the original rating score on one of the three scales, L is the lowest possible score on the rating scale used, and H is the highest possible score on the rating scale used. For example, an original Importance rating score of 3 is converted to a standardized score of 50 (50=[[3-1]/[5-1]]*100). For another example, an original Level rating score of 5 is converted to a standardized score of 71 (71=[[5-0]/[7-0]]*100).
In this case, S=((Original Data Value-1)/4. The original and standardized values for the Importance Scores of the various Abilities element of O*NET coded occupations 29-1111.00 and 29-2031.00 are shown in the following table:
The description continues in the full USPTO document.
 Lapsed, fee not paid9 drawings