 Lapsed, fee not paid13 drawings
Vehicles & Drones · US 8,531,314 B2
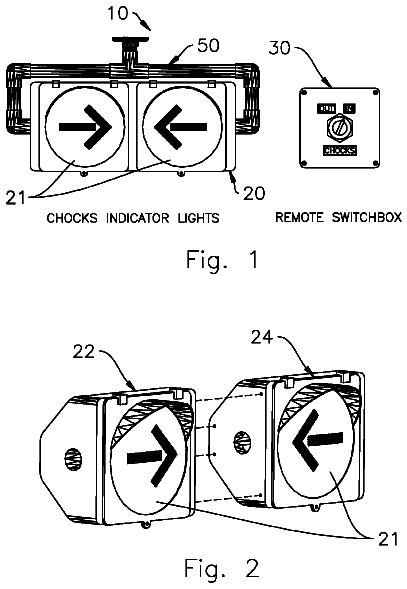
Illuminated aircraft wheel chock indicator
A visual display used to indicate when aircraft wheel chocks have been inserted against the aircraft tires and the tarmac.
US 8,532,648 B2 · Assignee: Telefonaktiebolaget L M Ericsson (Publ) · Inventors: Moritz; Simon et al.
Sheet 1 of 9 from the published document. All sheets in the USPTO PDF
Computers, a user equipment, a computer system, computer program products, and a method for a computer system are disclosed. In some embodiments, the method comprises the steps of: receiving user IDs, cell IDs and time stamps associated with the cell IDs and the user IDs; requesting and receiving, from a cell ID database, geographical coordinates corresponding to the cell IDs; finding stations and times for each user ID based on, at least in part, the geographical coordinates and time stamps associated with each user ID; exchanging the stations with a place for each one of the stations; generating at least one OD sub-matrix associated with each user ID based on, at least in part, places and times of arrival and departure associated with these places; and merging the OD matrices into an OD matrix.
Accurate estimation of origin/start and destination, hereinafter called OD estimation, is of interest in a number of use cases. It is, for example, of importance as basic data when planning a public transport system and when planning investments in new infrastructure like railways, trains, roads and buses. Today OD estimation is generally performed in one of two ways, either by surveys among people or by using measurements of e.g. the number of road vehicles that passes a certain place (link traffic). Surveys have some advantages over other techniques. You can for example get information on why a trip has been conducted, how many people that traveled in the same car and if they would have used public transportation if it had been available. A downside of surveys is that they are very expensive. Another downside with manually collected surveys is that people tend to forget how they travel
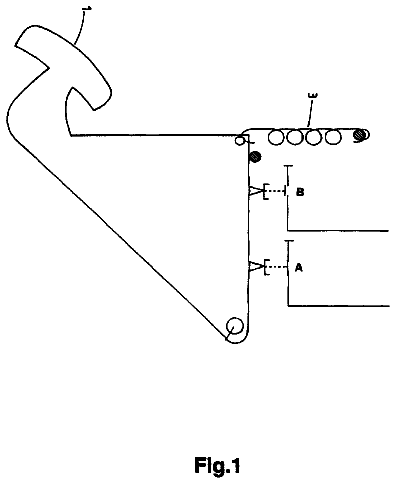
1 of 9 drawing sheets so far from the published document, cropped to the drawing. Every sheet is in the USPTO PDF.
What the patent claimed, word for word. All of it is now free to use.
The invention relates to a method, computers, a computer system, a user equipment and computer program products associated with generation of an OD (Origin Destination) matrix.
Accurate estimation of origin/start and destination, hereinafter called OD estimation, is of interest in a number of use cases. It is, for example, of importance as basic data when planning a public transport system and when planning investments in new infrastructure like railways, trains, roads and buses.
Today OD estimation is generally performed in one of two ways, either by surveys among people or by using measurements of e.g. the number of road vehicles that passes a certain place (link traffic).
Surveys have some advantages over other techniques. You can for example get information on why a trip has been conducted, how many people that traveled in the same car and if they would have used public transportation if it had been available. A downside of surveys is that they are very expensive. Another downside with manually collected surveys is that people tend to forget how they traveled, when they left their place of origin/starting point, when they arrived etc. Sometimes people also lie about their traveling for one or another reason. All in all, this might not give a good foundation on which to build accurate estimations.
Link traffic flows can be obtained from measurement devices, such as cameras and inductive sensors, installed along most major roads and the data from these measurement devices could be used for OD estimation. Even though this is probably cheaper than surveys, it still requires installation and maintenance of measurement devices. Also, it can only give an OD estimation along roads where there are measurement devices installed and the result will only be a rough estimate.
The estimate is often in the form of a two-dimensional OD matrix having, for example the destinations on one axis and the origin on the other. The values in the matrix relate to the frequency of each O-D pair, e.g. how many vehicles that have started from a certain origin and where their trip ended in a certain destination. Typically, there is an OD matrix for a certain period of time. Thus, in a three-dimensional matrix, a third axis could represent a certain time period.
The idea of making an OD estimation with the help of a cellular telecommunications network has been disclosed in [1] N. Caceres et al., "Deriving origin-destination data from a mobile phone network", IET Intell. Transp. Syst., Vol. 1, No 1, p 15-26, March 2007 and [2] K. Sohn and D. Kim, "Dynamic Origin-Destination Flow Estimation Using Cellular Communication System", IEEE Transactions on vehicular technology, Vol. 57, No. 5, September 2008. In the two studies OD matrices are calculated or enhanced in a simulation model by use of cellular network data. An approach taken is to use cellular network data to get link traffic counts, and then use the counts in the calculation of an OD matrix. A big advantage of the methods described in [1] and [2] from a privacy perspective, is that it is very hard, if not impossible, to identify a single individual, at least as long as the link traffic flows on busy roads is studied. A drawback with e.g. [2] is however that since handover information is used to estimate link traffic volume, it can only be applied to mobile phones when in a call or sending/receiving data. It can also only give a very approximate solution, since the problem of finding OD matrices form traffic link counts is under determined. In their simulation they also assume that a mobile telephone is always connected to the closest base station, which is a simplification which is not quite true.
Another approach of tracking people using mobile phones is disclosed in [3] Y. Asakura and E. Hato, "Tracking survey for individual travel behavior using mobile communication instruments", Transportation Research Part C 12, 273-291, 2004. This article discloses a methodology where applications are installed on mobile communication instruments (not mobile phones) in order to collect data about which base station the mobile communication instruments are connected to. Using that data and an algorithm, it is determined if a person is standing still or moving. A similar algorithm is also known from [4] J. H. Kang et al., "Extracting Places from Traces of Locations", Mobile Computing and Communications Review, Volume 9, No. 3, July 2005. [3] never addresses the problem of having higher degree of sparse data which would be the case with data obtained in a cellular network today. In [3], special devices are used to collect data on the signal strength from nearby base stations at given, regular and quite frequent times. The retrieved information is therefore much denser in time than in a network with cellular telephones for consumer use. Furthermore, there is no aggregation of data into something that could be utilized for OD-estimation, especially there is no generation of an OD matrix.
An object of the invention is to solve, or at least contribute to a solution of, the problem of creating a completely computerized solution for the generation of an OD matrix from data from one or more cellular telecommunications network.
The invention relates to a computer for supporting generation of an OD matrix based on, at least in part, network data associated with a plurality of user IDs. In one embodiment, the computer comprises: a receiving unit for receiving a user ID, cell IDs, and time stamps associated with the cell IDs and the user ID; a requesting unit for requesting and receiving, from a cell ID database, geographical coordinates corresponding to a cell ID; a station identification unit for finding stations and times based on, at least in part, the geographical coordinates and time stamps; a mapping unit for exchanging the stations with a place for each one of the stations; an OD matrix generating unit for generating at least one OD sub-matrix associated with the user ID based on, at least in part, places and times of arrival and departure associated with the places; and a sending unit for sending the OD sub-matrix to another computer. Hereby is achieved that an OD sub-matrix for one or more user IDs can be generated and sent for merging of a plurality of OD sub-matrices into an OD matrix. This can be done irrespective of how and where the network data is created. Since network data from at least one communications network is used, a large amount of data can be used, thus making the OD matrix useful for a more variety of purposes than they are today.
The invention also relates to another configuration of a computer for supporting generation of an OD matrix based on, at least in part, network data associated with a plurality of user IDs. In some embodiments, this computer comprises: a receiving unit for receiving a user ID, associated geographical coordinates, and time stamps associated with the geographical coordinates and the user ID; a station identification unit for finding stations and times based on, at least in part, the geographical coordinates and time stamps; a mapping unit for exchanging the stations with a place for each one of the stations; an OD matrix generating unit for generating at least one OD sub-matrix associated with the user ID based on, at least in part, places and times of arrival and departure associated with the places; and a sending unit for sending the OD sub-matrix to another computer.
The computers mentioned above may comprise a time adjustment unit for adjusting times of arrival and/or departure from the stations by a linear extrapolation based on, at least in part, data time stamped between the stations. Hereby is achieved that more accurate times for arrival and departures from stations are enabled, thus improving the accuracy of the OD matrix.
The computers may comprise: a clustering unit for clustering the stations into at least two clusters, and a calculation unit for calculating, for each one of the clusters, a position of a new station based on, at least in part, the stations belonging to the same cluster, and wherein the mapping unit instead of exchanging the stations exchanges the new stations with the respective place. Hereby the number of stations can be reduced and the accuracy of the OD matrix can be improved. The OD sub-matrices and OD matrices also becomes easier to understand and analyze, both by humans and machines.
The station identification unit may be configured to determine a geographical position associated with each time stamp for a user ID as either a first condition indicating that a user equipment associated with the user ID is moving or a second condition indicating that the user equipment is stationary, and create a station if the geographical position is determined to be in the second condition with respect to a first time stamp and is determined to be in the first condition with respect to a second time stamp immediately following the first time stamp, and the second condition preceding a change to the first condition has been maintained for a longer time than a time threshold. Hereby is achieved that an unnecessary number of station generations can be avoided. This increases the accuracy, size and usefulness of the OD matrix.
The station identification unit may also be configured to calculate a mean value for the geographical position of the station based on, at least in part, consecutive geographical positions related to the second condition. Hereby is achieved that the geographical position of a station can be determined more accurately thus improving the accuracy of the OD matrix. In this case the station identification unit may be configured to calculate the mean value also based on, at least in part, the time between the time stamps associated with the second condition in such a way that a longer time between two consecutive geographical positions gives a higher influence on the mean value than if the time would have been shorter. Hereby is achieved that account is taken for real-life situations where the network data associated with a user ID may be sparse. For example, when a user equipment for wireless telecommunication is in active mode, either in a call or sending data, the base station the user equipment is connected to is typically logged twice a second in network, but when the phone is in idle mode, the information on which base station the user equipment is connected to is only logged about once an hour (this varies between carriers, but is usually between 20 minutes and 2 hours).
The invention also relates to a computer system comprising at least one computer according to the two alternative main computer configurations above.
The computer system may utilize Hadoop map/reduce for generating the OD matrix. In that case the computer system comprises a master computer connected to the at least one computer, which in the computer system then is a slave computer. Hereby an architecture that is scalable is achieved, thus enabling the processing of big network data sets, which in turn improves the accuracy of the OD matrix.
Furthermore the invention relates to a method performed by a computer system for generating an OD matrix based on, at least in part, network data associated with a plurality of user IDs. In some embodiments, the method comprises the steps of: receiving user IDs, cell IDs and time stamps associated with the cell IDs and the user IDs; requesting and receiving, from a cell ID database, geographical coordinates corresponding to the cell IDs; finding stations and times for each user ID based on, at least in part, the geographical coordinates and time stamps associated with each user ID; exchanging the stations with a place for each one of the stations; generating at least one OD sub-matrix for each user ID based on, at least in part, places and times of arrival and departure associated with the places; and merging the OD sub-matrices into the OD matrix.
The method may comprise the step of storing the OD matrix in a non-volatile memory.
The method may comprise the step of adjusting times of arrival and/or departure from the stations by a linear extrapolation based on, at least in part, data time stamped between the stations.
The method may comprise the steps of: clustering the stations into at least two clusters, and calculating, for each one of the clusters, a position of a new station based on, at least in part, the stations belonging to the same cluster, and instead of exchanging the stations exchanges the new stations with the respective place.
Moreover the invention relates to a user equipment, e.g. a mobile telephone, for supporting generation of an OD matrix based on, at least in part, network data associated with a plurality of user IDs. The user equipment comprises: a unit for receiving or retrieving geographical coordinates and associated time stamps; a station identification unit for finding stations and times; a mapping unit for exchanging the stations with a place for each one of the stations; an OD matrix generating unit for generating at least one OD sub-matrix based on, at least in part, places and times of arrival and departure associated with these places; and a sending unit for sending the OD sub-matrix to a computer system.
The unit for receiving or retrieving geographical coordinates and associated time stamps may also be configured to receive or retrieve a user ID associated with the user equipment or a user of the user equipment. The sending unit may be adapted to send the user ID along with the OD sub-matrix.
The user equipment may comprise a time adjustment unit for adjusting times of arrival and/or departure from the stations by a linear extrapolation based on, at least in part, data time stamped between the stations.
The user equipment may comprise: a clustering unit for clustering the stations into at least two clusters, and a calculation unit for calculating, for each one of the clusters, a position of a new station based on, at least in part, the stations belonging to the same cluster, and wherein the mapping unit instead of exchanging the stations exchanges the new stations with the respective place.
The invention also relates to a computer program product for generating an OD matrix based on, at least in part, network data associated with a plurality of user IDs. In some embodiments, the computer program product comprises a non-transitory computer-readable medium storing a computer program for execution by a processor. In some embodiments, the computer program includes: code units for requesting, from a cell ID database, geographical coordinates corresponding to the cell IDs; code units for determining, for each of a plurality of user IDs, stations based on, at least in part, geographical coordinates and time stamps associated with each user ID; code units for exchanging the stations with a place for each one of the stations; code units for generating at least one OD sub-matrix associated with each user ID based on, at least in part, places and times of arrival and departure associated with the places; and code units for merging the OD sub-matrices into the OD matrix.
The invention also relates to a computer program product for supporting generation of an OD matrix based on, at least in part, network data associated with a plurality of user IDs. In some embodiments, the computer program product comprises a non-transitory computer-readable medium storing a computer program for execution by a processor. The computer program may include: code units for receiving or retrieving geographical coordinates and associated time stamps; code units for finding stations; code units for exchanging the stations with a place for each one of the stations, code units for generating at least one OD sub-matrix based on, at least in part, places and times of arrival and departure associated with the places, and code units for sending the OD sub-matrix to a computer system.
The objects, advantages and effects as well as features of the above mentioned embodiments will be readily understood from the following detailed description of the embodiments when read together with the accompanying drawings, in which:
FIG. 1 is a general illustration of a method,
FIG. 2 is a more detailed illustration of an embodiment of the method,
FIG. 3 is a flow chart illustrating steps according to an embodiment of a method,
FIG. 4 is a flow chart of an embodiment of how a computer is able to find stations and associated times made by a person,
FIG. 5 illustrates an adjustment of an arrival time at a station,
FIG. 6 is an illustration of an OD matrix,
FIG. 7 illustrates different embodiments of a computer according to an aspect of the invention,
FIG. 8 illustrates an embodiment of a computer that performs at least a part of the steps described in this document,
FIG. 9 shows a UE according to an embodiment,
FIG. 10 is a flow chart illustrating steps according to an embodiment of a method for a UE,
FIG. 11 illustrates different embodiments of a UE, and
FIG. 12 illustrates an embodiment of the UE according to FIG. 11.
The embodiments below cover various modifications and alternative implementations, and will hereinafter be described in detail. However it is to be understood that the detailed description and drawings are not intended to limit the general inventive idea to the specific forms disclosed.
Embodiments for generating OD matrices using telecommunications network operator data/information, in the following called network data, will be disclosed in the following. The telecommunications networks could of course be a GSM (Global System for Mobile Communications) network, a UMTS (Universal Mobile Telecommunications System) network, an LTE (Long Term Evolution) network or any future telecommunications network according to e.g. any 3GPP (3rd Generation Partnership Project) telecommunications standard. An important component for building knowledge of human mobility is to discover where and when people or vehicles go from one specific place to another specific place. From the network data knowledge of human mobility can be drawn and the network data could therefore be used for a number of different use cases/purposes. A technical problem solved by at least one embodiment described herein is how useful information/data about origin and destination of trips as well as their numbers, can be extracted from the network. Another technical problem solved by at least one embodiment described herein is to enable ways of making it easier for people to draw conclusions about how people and vehicles travel based on, at least in part, network data. The raw network data is available, but until this invention, the methods and means of how to extract this information did not exist.
Throughout this document the word "plurality" shall be interpreted as "at least two". Other terms that are used below include:
station/stationary point: origin or destination;
origin and destination: A station comprising the geographical coordinates longitude and latitude (and optionally altitude) in which vicinity a person spends a certain/predetermined amount of time. This means that a station has no relation in the system to be described to a physical place (before it is mapped to a place); it is just an approximate location of where a person has been stationary during the certain time, which may be set differently for different stations.
trip: A Trip is a data set comprising at least an origin and a destination as well as time of departure from the origin and time of arrival at the destination.
place: A place comprises a name or some sort of identity and the geographical coordinates for longitude and latitude and optionally altitude. It is however not the same as a station, but more related to a real world place, such as a building, a park, a train station, a bus stop, a taxi stand etc. A city or a larger geographical area could also be a place in some embodiments.
OD matrix: An OD-matrix comprises a set of places, and a number for each (sorted) pair of places that represents how many people/user traveled from the first to the second place (within a certain specified time-frame). An OD matrix is according to the disclosure herein a two-dimensional matrix with places on each axis or a three-dimensional matrix with places on two of the axis and time periods on the third axis. However, the skilled person understand that the form and in which way the OD matrix is stored in a computer memory is different in different implementations in dependence of how the OD matrix is going to be utilized. Even though the OD matrix may be stored and shown as a graphical image, it is in many embodiments more convenient to store an OD matrix as a list or table (a data set) with the following data: [place 1 of departure, place 2 of arrival, the number of people who have traveled from place 1 to place 2], [place 1 of departure, place 3 of arrival, the number of people who have traveled from place 1 to place 3] . . . . An OD matrix can be said to be a more aggregated form of an OD estimation or OD sub-matrices. An example is also illustrated and discussed more in detail in FIG. 6.
user ID: The user ID (identity) mentioned in this disclosure is anything that could be used to differentiate another user and/or UE (user equipment) from each other. Examples of types of user IDs are identities that are associated with a SIM (Subscriber Identity Module) card such as IMSI (International Mobile Subscriber Identity) or associated with a specific UE such as IMEI (International Mobile Equipment Identity). Other types of user IDs are OAuth (Open Authorization), e-mail address, MSISDN, and MAC (Media Access Control) address, but also customer numbers used by a telecommunications network operator for its customers. The user ID could also with respect to privacy and anonymity be generated by transforming a user ID received from a network operator to a user ID created for the sole purpose of the generation of an OD matrix.
FIG. 1 is a flow chart illustrating an overview of an embodiment of a method. Here network data 1 is received from an entity having the network data. The received network data 1 could be streamed from the entity or sent in batches, e.g. in the form of data sets. The received network data 1 comprises at least one event/information set in dependence of whether the network data 1 is received in a streamed fashion or sent in batches. Each information set comprises a user ID, network cell identity (hereinafter called cell ID) and an associated time (typically a time stamp). The received cell ID is the identity of a current cellular network cell in which a mobile UE of a user is or at a certain time has been positioned. Optionally, geographical coordinates corresponding to the cell ID can then be retrieved from a cell ID database 2. Trips, or rather stations and time of departure and arrival associated with the stations, made by each one of a group of people are found in a step A1 using user ID retrieved from the network data 1, associated time and either the cell ID or its geographical coordinates. The trips are thus recognized via the network data generated by the use of mobile UEs, such as mobile phones or computer tablets with cellular telecommunications capability. Having identified stations made by individual people, the stations for each user ID are aggregated in a subsequent step A2. The step A2 may also comprise the mapping of stations to places. Then the trips/stations for each one of the user IDs are aggregated/merged in step A3 and one OD matrix 3 or more OD matrices are generated and stored in a computer memory.
A more detailed embodiment of the method is illustrated in FIG. 2. In the illustrated embodiment, the method is implemented with the help of a distributed computer system 4. The network data 1 is here streamed from a first computer/server 5, which may be owned by a cellular network operator, to a second computer/server 6. The second computer 6 here belongs to the computer system 4 and distributes the network data 1 among a group of third computer/servers 7 which also are comprised in the computer system 4. The distribution is thus scalable and more easily adapted to large amount of data in that the third computers 7 can work in parallel. One way for the distribution is to utilize/implement Hadoop map/reduce with a master computer 8 as jobtracker. The master computer 8 may belong to the computer system 4 as well and in such an embodiment uses both the second computer 6 and the third computers 7 as slaves/tasktrackers. The number of parallel third computers 7 may be every number from two computers to several thousands using Hadoop map/reduce. As also indicated in FIG. 2, the master computer 8 also communicates with at least one fourth computer 9 for merging/aggregating OD matrices for a plurality of user IDs. The fourth computer 9 is in this Hadoop example also a slave and belongs to the computer system 4. In one embodiment an Hadoop cluster of 10 computers are used, where each slave computer process data associated with several user IDs. As also should be clear to the person skilled in the art of Hadoop implementation, the second computer 6 and the fourth computer 9 typically are not computers that only distribute tasks and merge OD matrices respectively, but they could also perform tasks which in the following are described as being performed by the third computers 7. In other words, one or more of the third computers 7 may also perform the tasks which in the following are described as being performed by the second computer 6 and the fourth computer 9 respectively.
FIG. 2 illustrates the steps made by one of the third computers 7, but it is apparent that the same steps are or could be made by the other third computers 7, the second computer 6 or the fourth computer 9. As also illustrated in the flow chart of FIG. 3 as step B1, the third computer receives events/information sets, each event comprising at least a cell ID, a time/time stamp and a user ID. The cell ID corresponds to which base station/Base Transceiver Station (BTS) the UE was connected to at the given time provided by the time stamp. By sending, in step B2, the cell ID to the cell ID database 2 for a cell ID lookup, i.e. a cell ID lookup request, the cell ID information is transformed by the cell ID database 2 into longitude and latitude coordinates, and optionally if the cell ID database happen to have altitude coordinates, also an altitude coordinate. Cell ID databases with an altitude coordinate is perhaps maybe not commercially available today, but may in the future be useful for e.g. distinguishing people waiting for a metro train at one level and other people waiting for another train at another level on the same metro station. The cell ID database 2 is here illustrated as being an external entity from the third computer, but it may of course be positioned in the third computer. In a step B3 the geographical coordinates are received by the third computer from the cell ID database 2 via a cell ID answer message. In one embodiment the cell ID lookup request is sent as an HTTP (Hypertext Transfer Protocol) request and the answer message received as an HTTP response. In another embodiment the cell ID look up can be made via an API (Application Programming Interface) such as location-API provided by the company Combain Mobile AB.
Even if steps B2 and B3 are illustrated as being performed by the third computers 7 in FIG. 2, these steps may in other embodiments of the computer system 4 be performed by one or more separate computers (not shown) which send the user IDs, the time stamps and the geographical coordinates to associated third computers 7.
Finding Trips/Stations
In a step B4, illustrated both in FIGS. 2 and 3, stations are found among the network data 1 and the associated geographical coordinates received from the cell ID database 2. In other words, the trips are here found without any knowledge of the location of any cities etc. This step B4 comprises the finding of all stations made by each user, of course supposing that each individual carry their mobile UE. Input network data 1 available for the user is evaluated, including user ID, time stamps and corresponding longitude and latitude. All stations associated with the user/UE are then output from this step/function. Finding trips might seem like an easy task, but the input data may be very sparse and with much fluctuations even if a person is perfectly still. It has for example been noticed that even in a stationary condition, the UE may switch base station up to 6 times with only a few seconds connected to each base station.
An embodiment of this step B4 is illustrated in more detail in FIG. 4. The step B4 is here an iterative process and defines each point, i.e. each geographical position associated with a time stamp for the user ID, as either a first condition here referred to as "moving" or a second condition here referred to as "stationary". As indicated in a sub-step B41, if a previous point in time (i-1 in FIG. 4) is a moving point, then the new point (i in FIG. 4) is defined as stationary, if it is geographically close enough to the previous point, i.e. a geographical distance D between the points is within a predetermined first distance threshold d1. As indicated in a sub-step B42, if the previous point is stationary, then the current/new point is stationary if it is close to a mean value position A (in FIG. 4) of all stationary points preceding it and if there is no "moving" points in between. In other words, the current point is stationary if the previous point i-1 is stationary and the distance D between the position of the current point i and the mean value position A of all the other stationary points after the last moving point is within a second distance threshold d2.
If the previous point is a stationary point and the new point is defined as moving, a station is created if the UE has been stationary longer than a certain time threshold T. In other words, the time difference between the current point and the earliest stationary point after the last previous moving point is here compared with the time threshold T and if the time difference is larger than the time threshold T, the station is created. This is indicated as sub-step B43 in FIG. 4. In an alternative embodiment of the sub-step B43, the time difference is calculated as being the time between the time of the earliest stationary point after the last previous moving point and the time of the point just before the current (moving) point. The geographical coordinates of the station is set as the mean value A. This embodiment of step B4 thus has three variable parameters: two distance thresholds, d1 and d2, and one time threshold T. The skilled person understands that the optimal values for the distance thresholds d1 and d2 and the time threshold T can be set according to a specific use case and/or geographical area. The skilled person appreciates that there would or at least could be differences between a rural area and a big city area. The distance thresholds d1 and d2 may have the same value in one embodiment of step B4. In one embodiment the distance thresholds d1 and d2 are set to 1000 meters and the time threshold T to 10 minutes. It should also be mentioned that more thresholds may be used in other embodiments of step B4, for example an additional time threshold which has to be passed for two stations to be counted as two separate stations. Another example is to add a minimum travel time or a minimum travel distance as another or additional way of separating stations in time or distance.
FIG. 4 should be self explanatory to the skilled person, but in order to avoid any possible confusion, a sub-step indicated as B44 "update A" should be mentioned. In this sub-step the mean value A of a possible station is here recalculated, taking the longitude and latitude of point i into account as well. In other words, if A has been calculated as the mean value of the coordinates of only two points in a sub-step B45, this A is in sub-step B44 recalculated, e.g. by calculating A as the mean position of the three points. The mean value A thus can be seen as a vector comprising the values of at least longitude and latitude. The calculation of the mean position A may in one embodiment be done by giving each point an equal weight, but in another embodiment the mean value A may be a weighted value/average by taking the time between points into account. For example, if a person is in a call, there might be only a second or less between points, but when the call ends and the phone enters a non-active/idle mode, there might be e.g. 30 minutes between points. Points can therefore be weighted in such a way that a longer time between two points gives a relatively high weight, e.g. a weight which is linearly proportional to the time between the corresponding points. In an embodiment the weighted mean value A may be calculated as being: A=(sum.sub.--i p.sub.--i*t.sub.--i)/(sum.sub.--i t.sub.--i) where sum_i means that it is a sum over i, p_i is point i and t_i is the time between point i and point p_(i+1). Alternatively, t_i can be the time between p_i and p_(i-1), or (p_(i+1)+p_(i-1))/2.
Since A here is a vector, the calculation is done over each vector component, i.e. with respect to at least longitude and latitude.
All the generated stations together with the associated arrival times and departure times and user ID from each one of the stations are output from step B4.
Fine Tuning Arrival Time and/or Departure Time
Since there are a lot of fluctuations in a cellular telecommunications network and its generated network data even if a person is standing still, the distance thresholds d1 and d2 may have to be set quite long in order to not erroneously determine a stationary user/UE as moving. Therefore, when a user starts moving with his/her UE, he/she might be classified as stationary for a while longer than he is in reality. Hence the actual time of departure and arrival might not accurately correspond to the time between a stationary point and a moving point determined in step B4. In an optional tuning step B5, the departure times and arrival times are re-determined/fine tuned/adjusted. By analyzing the points belonging to a station, it is possible to better predict when the user actually left the place. One way of doing this is by utilizing an extrapolation method, e.g. a linear extrapolation as illustrated in FIG. 5. In the illustrated example, the X-axis is time and the Y-axis is distance. All the white points are points based on, at least in part, the received network data 1 and the determination of stations and times of arrival and departure in step B4. If a departure time from station A would have been determined based on, at least in part, the white points, it would be about 13:00, and the arrival time at stations B would be about 15:00. However, with the illustrated linear extrapolation based on, at least in part, the white points in between, the departure time from station A would be about 13:15 and the arrival time at station B about 14:15. The use of the linear extrapolation could in step B5 be used for fine-tuning the arrival and departure times of all trips, but in other embodiments of the optional step B5 be utilized for trips which fulfills certain criteria, such as trips having a length above a certain time threshold and or having a certain number of "moving" points between the two stationary points. In FIG. 5, the number of "moving" points is six.
Clustering Stations
Sometimes the points might be very sparsely distributed in time, and there might only be a few points defining a station. This may result in a very or relatively poor estimate of where the user has been stationary. Since a user often visit a place more than once, all stations belonging to a user may be compared to determine more accurately where the user actually has been. This is done with the help of the optional step of B6. As input the function/step takes all the stations identified in step B4 and belonging to a user ID. The stations are then grouped together using a clustering method, e.g. any clustering method where the number of clusters does not have to be specified beforehand. A suitable clustering method is a mean shift clustering. The advantage of the mean shift clustering method is that it doesn't require any a priori knowledge of the number of clusters and does not constrain the shape of the clusters. More information about the mean shift clustering could be retrieved e.g. from http://homepages.inf.ed.ac.uk/rbf/CVonline/LOCAL_COPIES/TUZEL1/MeanS- hift.pdf, retrieved on 14 Jul. 2011, and hereby incorporated by reference.
Examples of alternative clustering methods are density clustering methods and hierarchical clustering methods. Step B6 may in one embodiment be performed before or in parallel with the tuning step of B5, even though it is illustrated in FIG. 3 as being performed after the tuning step B5. The clustering step B6 may be configured in such a way that it rather fails to group two stations that should be grouped together than grouping two stations that should not be grouped together.
Calculating New Position for Stations
In embodiments where step B6 is performed, a seventh step B7 follow in which each cluster is determined to be a new station which replaces the stations on which it is based, i.e. the stations generated in B4. The position of the new station/cluster may be calculated in this step B7 to be the mean position of the positions of all stations from step B4 included in the same cluster. All the new stations as well as their calculated position and time of arrival and departure are forwarded to the next step B8.
Map Stations to Places
In order to make an OD-matrix which is relatively easy for a human to understand, the stations have to be aggregated into something that is easier to overlook and draw conclusions from. This can be done in two different ways, either with or without a priori knowledge about what places to look at.
The advantage of having defined what places to look at, is that the assigning of a station (from either step B7, B5 or step B4 in dependence of embodiment) to a place is easy and fast and there is always a name for each place assuming that names are provided. The disadvantage is that stations might be grouped together into a place in a way that doesn't really reflect the way they might be intuitively clustered in the real world by a human or organization/company.
What places to look at can either be defined manually or obtained from one or more GIS (Geographic Information System) 10, for example OpenStreetMap, Google earth and Google maps. In FIG. 2, the GIS 10 has been illustrated as being hosted by an external server, but it might of course be hosted by one or more of the third computers 7 or another computer of the computer system 4. API messages or HTTP messages may typically be used in the communication with the GIS, e.g. one of the APIs for Google map.
The description continues in the full USPTO document.
About 6,670 words. The USPTO PDF has it with every drawing.
Fees are due 3.5, 7.5 and 11.5 years after grant. This patent expired on September 10, 2025, so the fee marked "not paid" was the one that went unpaid.
Generating an OD Matrix
Filed Feb 2012 · published Feb 2013Generating an OD matrix
Filed Feb 2012 · granted Sep 2013Earlier publications, parents and continuations. None of them can still be enforced, or this patent would not be listed.
Prior art cited by the examiner or applicant. Useful when you check your own idea for novelty.
Everything on this page comes from the documents linked above.